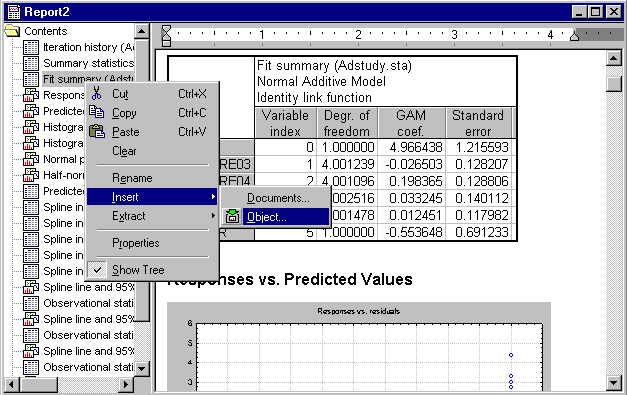
Report Tree Overview
The report tree displays the organization of files in the report. The files are displayed in an Explorer-style format; objects are displayed sequentially and represented by their respective icons. This tree view offers a convenient way to locate a specific object or document, rearrange objects and documents (by dragging or via the Clipboard), etc.
You can embed any type of Statistica document in a report, including spreadsheets, graphs, and analyses. In addition to Statistica document types, you can embed other types of ActiveX/OLE objects in reports, including Excel spreadsheets, Word documents, and others. To edit one of these types of embedded documents, double-click on the document. The file opens in the viewer, and the Report toolbar merges with the toolbar from the embedded file's native application, giving you access to all of the editing features you need.
Items in the tree are identified by the icon next to them. The
![]() spreadsheet,
spreadsheet,
![]() macro, and
macro, and
![]() graph icons represent Statistica documents, spreadsheets, macro, and graphs respectively. All non-Statistica documents are represented by their document icons. For example, Word documents are represented by the
graph icons represent Statistica documents, spreadsheets, macro, and graphs respectively. All non-Statistica documents are represented by their document icons. For example, Word documents are represented by the
![]() Word icon, and Excel spreadsheet files are represented by the
Word icon, and Excel spreadsheet files are represented by the
![]() Excel spreadsheet icon.
Excel spreadsheet icon.
The report tree can be organized and modified using drag-and-drop features as well as Clipboard procedures.
Commands for inserting, extracting, renaming, and removing items from the report tree are available from the report tree shortcut menu (accessed by right-clicking anywhere in the tree, as shown above).

