Example 16: A Structural Model for 10 Personality and Drug Use Variables
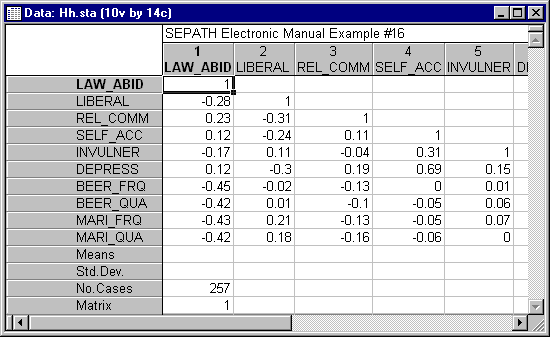
Huba and Harlow (1987) present a structural model relating personality characteristics to alcohol and marijuana consumption in adolescents. The correlation matrix (to the two-digit level of precision given in their printed article) for their data, based on 257 observations, is given in the Hh.sta data file.
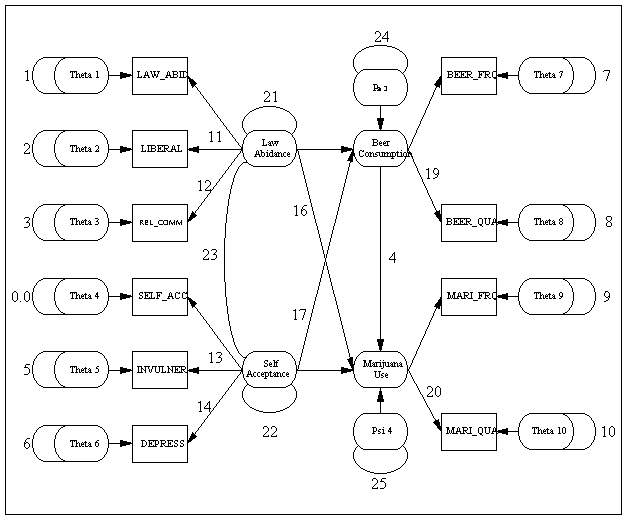
Their first model corresponds to the path diagram below.
The file Hh.cmd contains a PATH1 representation of the model. We urge the user to try to produce the PATH1 statements corresponding to the figure before examining the contents of Hh.cmd (found in the /Examples/Datasets/SEPATH directory of STATISTICA). The file Hh.cmd is designed to replicate the analysis in the original article. Results obtained with SEPATH will correspond very closely, but not exactly, to those reported in the first column of Table 2 in Huba and Harlow (1987). We assume the discrepancy is due to the fact that we are using the correlations from their article, which they reported to only two digit accuracy.
If you experiment with this example, you will discover a number of interesting things about it. For one thing, it is difficult to find the solution point for this problem. (See a discussion on this point in Solving Iteration Problems.) Select Structural Equation Modeling from the Statistics - Advanced Linear\Nonlinear Models menu. In the resulting Structural Equation Modeling dialog click on the Advanced tab and click the Set parameters button. Select Automatic under Initial values and Correlations under Data to Analyze.
Try reversing some of the paths. If you experiment for a while, you will discover that there are other models, besides the one in the above figure, that fit the Huba-Harlow data as well as the one in their article. The theoretical reason for this can be found in an article by Lee and Hershberger (1990), who gave rules for visually inspecting path diagrams to detect paths that may be reversed without altering model fit.


