Paste (Block) Button
Click the
![]() button (or press CTRL+V) to paste the current contents of the Clipboard into a STATISTICA document starting at the current cursor position. See Cut (Block) for a description of differences between global operations on cases and variables (which treat cases and variables as logical units, see
button (or press CTRL+V) to paste the current contents of the Clipboard into a STATISTICA document starting at the current cursor position. See Cut (Block) for a description of differences between global operations on cases and variables (which treat cases and variables as logical units, see
![]() Global operations on cases and
Global operations on cases and
![]() Global operations on variables), and Clipboard operations, which follow the standard spreadsheet Clipboard conventions. For example, when you intend to copy (via the Clipboard) an entire variable to a new location, make sure that the cursor is placed at the top of the destination column, because the data will always be pasted from the cursor down (even if the entire destination column is highlighted).
Global operations on variables), and Clipboard operations, which follow the standard spreadsheet Clipboard conventions. For example, when you intend to copy (via the Clipboard) an entire variable to a new location, make sure that the cursor is placed at the top of the destination column, because the data will always be pasted from the cursor down (even if the entire destination column is highlighted).
- Clipboard operations in the spreadsheet
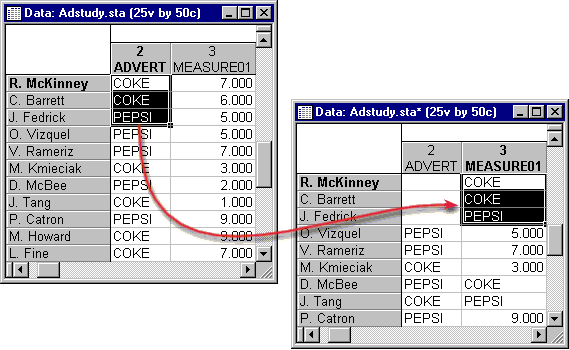
- When you copy or move a block in a spreadsheet (e.g., via drag-and-drop), the values that are copied depend on the display mode of the spreadsheet. If the spreadsheet displays numeric values when the block is copied to the Clipboard, then only those numeric values will be copied. If the spreadsheet displays text labels when the block is copied to the Clipboard, then not only are the text labels copied to the Clipboard, but also the corresponding numeric values. This can result in the assignment of text labels to numeric values that did not previously have text label equivalents (see below).
- Display formats in spreadsheets
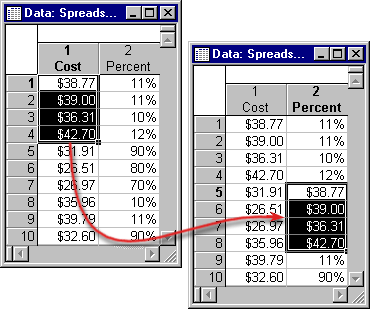
- When you copy or move a block in a spreadsheet, the display format for that block is also copied.
This means that the display format of the copied or moved block will overwrite the display format for the block into which it is copied. For example, if you copy a block of values that are formatted as currency and paste them into a variable that is formatted as percentage, the block will remain formatted as currency even though the rest of the values in that variable are formatted as percentage (see illustration above).


