Example 3: Main Effects ANOVA Design
The data file Adstudy.sta contains 25 variables and 50 cases. These (fictitious) data were collected in an advertising study where male and female respondents evaluated two advertisements. Respondents' gender was coded in variable 1 (Gender: 1=male, 2=female). Each respondent was randomly assigned to view one of the two ads (Advert: 1=Coke, 2=Pepsi). They were then asked to rate the appeal of the respective ads on 23 different scales (Measure01 to Measure23). On each of these scales, the respondents could give answers between 0 and 9.
- Specifying the Analysis
- There are several possible approaches to analyzing this data. For this example the design will be viewed as a 2 main effects design, in which the Gender main effect on responses is assessed controlling for the Advert main effect, and the Advert main effect on responses is assessed controlling for the Gender main effect. The design will not include the Gender by Advert interaction (although inclusion of the interaction effect could be appropriate).
Ribbon bar. Select the Home tab. In the File group, click the Open arrow and select Open Examples to display the Open a STATISTICA Data File dialog box. The Adstudy.sta data file is located in the Datasets folder. Then, select the Statistics tab. In the Advanced/Multivariate group, click Advanced Models and from the menu, select General Linear to display the General Linear Models (GLM) Startup Panel.
Classic menus. From the File menu, select Open Examples to display the Open a STATISTICA Data File dialog box. The Adstudy.sta data file is located in the Datasets folder. Next, from the Statistics - Advanced Linear/Nonlinear Models submenu, select General Linear Models to display the General Linear Models (GLM) Startup Panel.
For this example we will specify the analysis using the GLM Analysis Wizard (the analysis could also be easily specified using the Main effect ANOVA Quick specs user interface).
Select Analysis Wizard as the Specification method. Then click the OK button to display a standard variable selection dialog box for specifying the variables to be used in the analysis.
Select Measure01 through Measure23 as the Dependent variables and select Gender and Advert as the Categorical predictor variables. Click the OK button to gain access to the GLM Analysis Wizard--Between Design dialog box.
When only categorical predictor variables have been selected for an analysis, the default between designs is a full-factorial design.
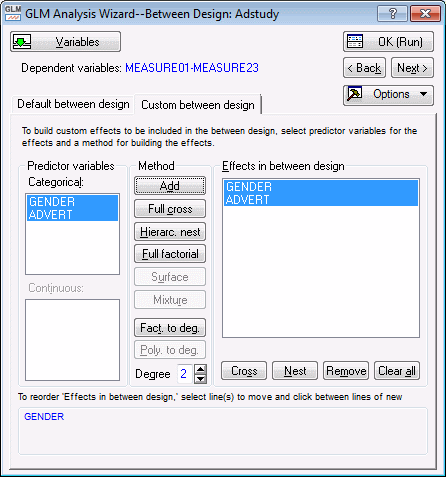
To specify the desired main effects design for this example, select the Custom between design tab. In the Predictor variables group box, in the Categorical box, select Gender and Advert.
Then, in the Method group box, click the Add button to create main effect terms for the selected predictor variables. These terms will be displayed in the Effects in between design box.
To view this syntax, click the Next > button in the GLM Analysis Wizard Between Design dialog box, and then click the Syntax editor button in the GLM Analysis Wizard Extended Options dialog box to display the GLM Analysis Syntax Editor.
The remainder of the specifications for this analysis can use the default specifications, so click the OK (Run) button in either the GLM Analysis Syntax Editor or the GLM Analysis Wizard Between Design dialog box to perform the analysis.
- Results
- When the
GLM Results dialog box is displayed, click the All effects button (located on the
Quick tab).
The summary table of multivariate tests shows that neither the main effect for Gender nor the main effect for Advert approach significance, p's > .30. Now click the Univariate results button on the Summary tab to create a spreadsheet with summary tables of the univariate tests of significance of the Gender and Advert main effects for each dependent variable.
Shown above is part of the Univariate Results for Each DV spreadsheet. Consistent with the multivariate results, only 3 of the 46 main effects (2 for each of the 23 dependent variables) are significant at p<.05.
See also GLM - Index.


