Statistica Data Miner
General Overview
The most comprehensive and effective system of user-friendly tools for the entire data mining process - from querying databases to generating the final reports.
- Choose from the largest selection of algorithms on the market (based on the Statistica technology) for classification, prediction, clustering, and modeling.
- Access and process huge data sets in remote databases in-place (see the Streaming Database Connector glossary topic and Streaming Database Connector Technology). Off-load time-consuming database queries to the server.
- Access huge data files on your local (desktop) Windows computer; as specialized queries into custom data warehouses are sometimes expensive (requiring the services of designated consultants), it can be more cost effective to download even huge databases to your local machine; such data files can then be processed with unmatched speed by Statistica Data Miner routines.
- Choose data mining project templates from menus. With only a few clicks of the mouse you can apply even advanced methods such as meta-learning techniques (voting, bagging) to your specific analysis problems.
- Integrate diverse methods and technologies into the data mining project, from quality control charting and process capability analysis, Weibull analysis, power analysis, or linear and nonlinear models, to advanced automated searches for neural network architectures; all Statistica procedures can be selected as nodes for data mining projects, and no programming or custom-development work is required to use these procedures.
- Use Graphical/visual data mining. All of Statistica 's unique and unmatched graphical capabilities are available for data mining; choose from hundreds of graph types to visualize data after cleaning, slicing, or drilling down.
- Work more efficiently with the Intuitive user-interface and full integration with Statistica 's award winning solutions. You will be up-and-running in minutes.
- Interactively explore, drill down on, chart, etc. all intermediate results. Complete integration into Statistica and web (Statistica Enterprise Server) applications.
- Organize results in reports, spreadsheets, graphs, etc., or publish results on the Web.
- Access Statistica 's comprehensive library of analytic facilities.
- Update analyses and results automatically when the data change.
- Open architecture design. Fully integrate your own proprietary algorithms and methods, or third-party algorithms.
- Develop highly customized data mining systems specifically tailored to your needs. Fully programmable and customizable system (using the industry standard languages such as the built-in Visual Basic, C++/C#, Java, etc.).
- Automatically deploy solutions in seconds, using built-in tools, or add automatically generated computer code for deployment (in C++, PMML) to your own programs.
Statistica Data Miner is designed for two general categories of users:
- Customers who need a complete, deployed, and ready to use solution, designed to solve a specific type of problem (such as customer credit scoring, predicting specific aspects of customer behavior or providing answers to specific CRM questions, managing the risk of an equipment failure using a model based on the mining of a very complex set of historical data). For these customers, Statistica offers a complete installation and deployment of data mining solutions that will draw data from an existing corporate database or data warehouse and generate predictions or ratings using a specific model that Statistica consultants will deploy on site (services to develop a data warehouse solution or restructure the existing one are also available). These specialized data mining solutions can later be modified (by Statistica or other consultants) as the needs of the company change. The modification of such already deployed systems are very easy because all Statistica solutions are stored in form of industry standard VB scripts), and they can readily be deployed in the industry standard C++ code.
- Customers who need a general powerful data mining solution development system, to be used to design and deploy custom systems (in-house) by the corporate analysts and IS/IT personnel. These customers will license the same set of tools, following the same price structure as the customers from the previous category (see above) except that they will not order the deployment and consulting services.
Advanced Software Technology = Efficient and Elegant User Interface
Statistica Data Miner is based on technology that offers both a) the full advantages of the interactive, point and click user interface and b) complete programmability and customizability.
Statistica analysis objects and nodes
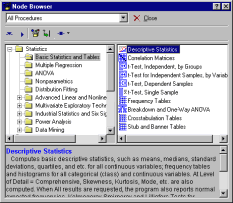
At the heart of Statistica Data Miner is a set of more than 300 highly optimized, efficient, and extremely fast Statistica procedures embedded in user-selectable nodes, which are used to specify the relations between the procedures (objects) and control the logic of the project (and the flow of data). This flexible, customizable architecture delivers the full functionality of all statistical and analytic procedures to the data mining environment as self-contained analysis objects. Behind each node, and accessible to advanced users of the Statistica Data Miner system, are simple scripts (analysis objects encoded in industry-standard Visual Basic) that serve as the wrappers or glue for defining the flow of data through the project, while the actual numerical analyses are performed via the extremely fast analytic procedures of Statistica . These objects, which can be used as the nodes for data cleaning and/or filtering, and for analyzing the data, are organized in the Node Browser.
Nodes for data input and data acquisition.
Here you can create and store the scripts necessary to connect to remote (protected) data sources on a server. Of course, you can also analyze Statistica data files or place holders for in-place processing of remote databases (see Streaming Database Connector Technology), in which case no special nodes (scripts) have to be created.
Nodes for data filtering, cleaning, verification, feature selection, and sub-sampling
These options are essential to data mining to detect and correct erroneous information that may bias final conclusions; the sub-sampling facilities are useful for analyzing very large data sets to extract random samples for further analyses. The feature selection options enable you to automatically select informative variables (predictors) from among, for example, hundreds of thousands of possible predictors (see also Feature Selection and Variable Screening).
Nodes for data transformations and file restructuring
With these options, you can further prepare the data for the analyses. For example, you could aggregate across variables, to compute indices that summarize several variables (columns) in the input data ( compute the average number of defects found in a part by averaging across variables representing different types of defects).
Nodes for data analyses
These nodes contain the full functionality of all Statistica analyses and graphics capabilities; hundreds of procedures are available to address essentially all analytic needs that can possibly arise in your data mining project.
Creating the data mining project
These nodes can simply be connected in the data mining workspace.
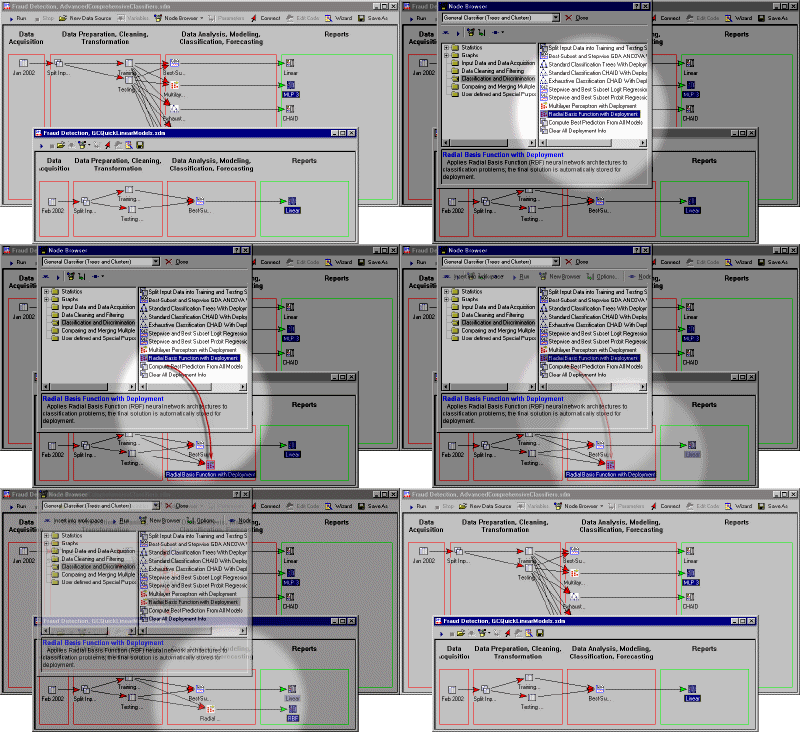
The data mining workspace is a structured, highly efficient, user-friendly data analysis environment, where you can move around and interconnect data, analyses, and results by simply dragging icons and connecting arrows. You can simultaneously open, modify, and run as many data mining workspaces as you like and drag nodes (objects) between workspaces and node browsers.
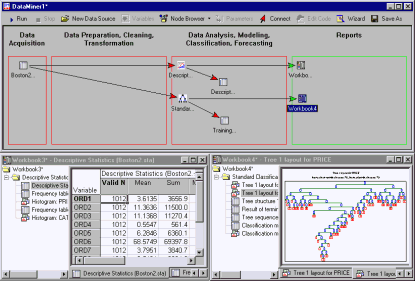
Creating a data mining project is easy. Many users of Statistica Data Miner will never need to go beyond this simple interactive point and click user interface.
Specifying complex models
The simple user interface - based on point-and-click selections from menus and browsers - enables you to apply even very advanced methods. Several comprehensive and flexible project templates can be selected to address common data mining tasks. For example, in order to find a good model for predicting credit risk of new clients based on historical data that includes various potentially useful predictors, you could simply select the template for the Advanced Comprehensive Regression Models project.
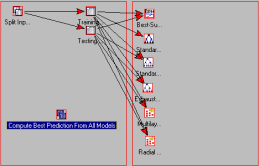
All you need to do next is connect your historical data, specify the variables of interest, and train the project. Thus, in just a few seconds (select data file, select variables, select the arrow tool to connect the data), Statistica will automatically:
- Create two samples for training and for cross-validation to avoid over-fitting;
- Apply best subset linear regression, standard regression trees algorithms, CHAID and exhaustive CHAID, a 3-layer multilayer perceptron neural network, and a radial basis function neural network to find a good model for predicting credit risk;
- Combine all responses into a meta-learner that picks the best model, or combines the predictions from multiple models.
After applying these cutting-edge techniques for modeling linear, nonlinear, or even chaotic relationships, you are ready for deployment. Simply connect the data source for the new data (new customers) to the Compute Best Prediction From All Models node, and the program will automatically apply the fully trained models to derive the best prediction possible.
Speed
The analysis nodes (objects) contain the full functionality of Statistica , encapsulated into nodes that can further be customized using standard Visual Basic syntax. The actual analyses are performed via the highly optimized Statistica analysis modules, which have been refined for almost two decades to deliver maximum speed, capacity, and accuracy
Large data sets
Statistica Data Miner uses a number of technologies specifically developed to optimize the processing of large data sets, and it is designed to handle even the largest scale computational problems and process very large databases. For example, data sets with over one million variables can be processed and screened automatically (using a wide selection of methods) to search for best predictors or most relevant variables.
Customizing analyses
The analyses or data cleaning/filtering operations implemented by the nodes of Statistica Data Miner can further be customized by simply double-clicking on the respective icons. Every icon contains the options to fully customize the respective operations; for example, clicking on a neural network node will display a dialog (and dialog help) for customizing the specific analysis (to change the number of iterations, number of layers in the network, the detail of reported results, etc.).
Saving the project
The entire project (workspace) can be saved, along with all customization, intermediate data sources, comments, etc. Routine analyses (for regular updating of a trained complex set of models for voted classification based on various methods) can be saved and later applied by clicking on a single button (update).
Technical Note: Statistica Data Miner Node Scripts
Statistica Data Miner computational routines are extremely fast and highly optimized. For example, in the Statistica Enterprise Server Client-Server environment, the program will automatically take advantage of multi-processor and/or multiple-server architectures (with proper hardware support), to evaluate models via multiple simultaneous processes (multithreading, distributed processing). Moreover, the highly optimized routines for processing data will outperform other software in head-to-head comparisons. Yet, advanced users will find it very easy to customize the system.
Each node in Statistica Data Miner consists of a standardized Statistica Visual Basic script (that calls the respective Statistica procedures), with access to additional functions to provide the user interface to further customize analyses. It may never be necessary to modify or customize these scripts; however, if your in-house IT department or consultants want to insert proprietary algorithms into Statistica Data Miner, this can very easily be accomplished. A simple node script may look like this:
Private Sub SubsetNode( _
DataIn() As InputDescriptor, _
DataOut() As InputDescriptor)
ReDim DataOut(LBound(DataIn()) To UBound(DataIn())) _
As InputDescriptor
For i=LBound(DataIn()) To UBound(DataIn())
Set DataOut(i)= DataIn(i).Clone()
Next i
End Sub
This program will simply copy the data source information (element in input array DataIn(i)) from each data source, and pass it on for further processing in DataOut(i). Any number of proprietary or highly customized numeric operations could be performed inside the script, to change practically all aspects of the data, or to apply any of the thousands of analytic functions available in Statistica Visual Basic. This general open architecture of Statistica Data Miner provides numerous unique (to data mining software) advantages (also further elaborated in Unique Features).
- Each node can handle multiple data sources on input, and multiple data sources on output; identical operations can be applied to multiple data sources via a single node.
- A data source can be a mapping into a database that does not need to actually (physically) reside on the machine running Statistica Data Miner, nor does it have to be copied; this is extremely important for the processing of large data sets, as they commonly occur in data mining (see Streaming Database Connector Technology).
- You can perform operations within and between data sources. For example, you could merge data in different remote databases into a single data file for further processing with Statistica Data Miner analytic nodes.
- Visual Basic itself is a simple, object-oriented language, available for most industry-standard application programs; there is a virtually limitless supply of programming resources, talented and experienced programmers, and ready-to-use third-party applications that can be integrated with Statistica Data Miner; likewise, Statistica Data Miner can be integrated with other applications, for example, to automatically deliver results to the Web or e-mail, or to export results into other applications. Also, a fully Web-based version of Statistica Data Miner, powered by Statistica Enterprise Server is available.
- Statistica 's macro recording facilities will automatically record interactive analyses, which can easily be converted into scripts for custom nodes.
- Where applicable, Statistica 's analyses contain options for generating Statistica Visual Basic code for deployment (of trained neural networks). Those scripts can be directly used in scripts for custom deployment nodes.
Deploying solutions
Statistica Data Miner includes a complete deployment engine, and the results of analyses via Statistica Data Miner can be deployed (applied to new data or inside other automated data processing systems) in several ways.
Automatic deployment of models
Data mining templates with deployment for standard types of analyses can be chosen from menus. Select a template, connect training data to estimate models, and you are ready to apply the best solution (average solution, voted solution, etc.) to new data; the end user only needs to connect new data to the deployment node to compute predictions, classifications, forecasts, etc.
PMML-based rapid deployment of predictive models
The Rapid Deployment of Predictive Models options provide the fastest, most efficient methods for computing predictions from fully trained models; in fact, it is very difficult to beat the performance (speed of computations) of this tool, even if you were to write your own compiled C++ code, based on the (C/C++/C#) deployment code generated by the respective models. The Rapid Deployment of Predictive Models options enable you to load one or more PMML files with deployment information and to compute very quickly (in a single pass through the data) predictions for large numbers of observations (for one or more models). PMML (Predictive Models Markup Language) files can be generated from practically all analytic procedures for predictive data mining (as well as the Cluster Analysis (Generalized EM, k-Means & Tree) options). PMML is an XML-based (Extensible Markup Language) industry standard set of syntax convention that is particularly well suited to enable sharing of deployment information in a Client-Server architecture ( via Statistica Enterprise Server).
C/
C++/C#, Visual Basic code generator optionsCode-generator options are also available for regression (prediction of continuous variables), classification (prediction of categorical variables), and clustering types of problems; for example, you can save C++ code or Visual Basic code that implements the prediction from tree-classification algorithms, linear discriminant function analysis, generalized linear models, neural networks, MARSplines (multivariate adaptive regression splines), k-means or EM clustering solutions (unsupervised learning), etc. The code generated by these options can quickly be integrated into custom programs for deployment. For example, the Visual Basic code generated from Statistica analysis modules will seamlessly integrate into the Statistica Data Miner architecture; based on the Visual Basic code generated by Statistica , custom deployment nodes can be programmed in minutes, even by inexperienced programmers.
Deployment via
Statistica Visual BasicThe Visual Basic code generated from Statistica analysis modules will seamlessly integrate into the Statistica Data Miner architecture (see Technical Note); based on the Visual Basic code generated by Statistica , custom deployment nodes can be programmed in minutes, even by inexperienced programmers.
The methods for predictive data mining and clustering support XML-syntax based PMML (Predictive Models Markup Language) deployment. You can save all information required for deployment in a PMML file and use the Rapid Deployment of Models options to compute predicted values or classifications for one or more models, passing through the data only once. Hence, this method of deployment is particularly well suited for computing predictions or predicted values for large numbers of observations. Further, these files can be efficiently deployed via the Statistica Enterprise Server Client-Server version of Statistica Data Miner, so you can train models on your local machine and deploy solutions to a server, or vice versa.
Unique Features of Statistica Data Miner
Statistica Data Miner contains the most comprehensive and effective system of user-friendly tools for the entire data mining process - from querying databases to generating final reports.
- To the best of our knowledge, Statistica Data Miner contains the most comprehensive selection of data mining methods available on the market (e.g., by far the most comprehensive selection of clustering techniques, neural networks architectures, classification/regression trees, multivariate modeling (including MARSplines), and many other predictive techniques; the largest selection of graphics and visualization procedures of any competing products)
- A selection of comprehensive, complete data mining projects, ready to run, and set up to competitively evaluate alternative models [using bagging (voting, averaging), boosting, stacking, meta-learning, etc.], and to produce presentation-quality summary reports
- An extremely easy to use, drag-and-drop based user interface that can be used even by novices, but is still highly flexible and customizable, and provides one-click access to the underlying scripts
- Powerful, interactive data exploration (drilling, slicing, dicing) tools, including the most comprehensive selection of interactive, exploratory graphics-visualization tools available in any product
- Ability to handle/process simultaneously multiple data streams
- Optimized for processing extremely large data sets (including options to pre-screen even over a million of variables, and/or draw stratified or simple random samples of records using DIEHARD-certified random sampling procedures)
- Highly optimized access to large databases, including the Streaming Database Connector technology that reads data asynchronously directly from remote database servers (using distributed processing if supported by the server), and bypassing the need to import data and create a local copy
- Flexible deployment engine, integrated with custom development environment allowing you to manage optimized analytic objects (nodes) for data mining using quick, industry standard, Visual Basic scripts (VB is built into the system)
- Extremely fast and efficient deployment via portable, XML syntax based PMML (Predictive Models Markup Language) files for prediction, predictive classification, or predictive clustering of large data files; trained models can be shared between desktop and Statistica Enterprise Server Data Miner (Client-Server) installations (see below)
- Open, COM-based architecture, unlimited automation options, and support for custom extensions (using industry standard VB (built in), Java, or C/C++/C#)
- Desktop or Client-Server options
- Multithreading and distributed processing architecture delivers unmatched performance (offered in the Client-Server version) including super-computer-like parallel processing technology that optionally scales to multiple server computers that can work in parallel to rapidly process computationally intensive projects
- Complete Web-enablement options (via Statistica Enterprise Server, offering support for all data mining operations, including the interactive model building, via an Internet browser using any computer connected to the Web); this ultimate enterprise data analysis/mining system enables you to manage projects over the Web and work collaboratively across the hall or across continents.
- Statistica Data Miner is a truly unique application in terms of its sheer comprehensiveness, power, and technology, and flexibility of the available user interfaces
- Choose from the largest selection of algorithms on the market (based on the Statistica technology) for classification, prediction, clustering, and modeling
- Access and process huge data sets in remote databases in-place; off-load time-consuming database queries to the server
- Access huge data files on your local (desktop) Windows computer; as specialized queries into custom data warehouses are sometimes expensive (requiring the services of designated consultants), it can be more cost effective to download even huge databases to your local machine; such data files can then be processed with unmatched speed by Statistica Data Miner routines
- Data mining project templates can be selected from menus; with only a few clicks of the mouse, you can apply even advanced methods such as meta-learning techniques (voting, bagging, etc) to your specific analysis problems
- Integrate diverse methods and technologies into the data mining project, from quality control charting and process capability analysis, Weibull analysis, power analysis, or linear and nonlinear models, to advanced automated searches for neural network architectures; all Statistica procedures can be selected as nodes for data mining projects, and no programming or custom-development work is required to use these procedures
- Graphical/visual data mining: All of Statistica 's unique and unmatched graphical capabilities are available for data mining; choose from hundreds of graph types to visualize data after cleaning, slicing, or drilling down
- Intuitive user interface and full integration with Statistica 's award winning solutions: you will be up-and-running in minutes
- Complete integration into the Statistica and web (Statistica Enterprise Server) applications; interactively explore, drill down on, chart, etc., all intermediate results
- Organize results in reports, spreadsheets, graphs, etc., or publish results on the Web
- Access to Statistica 's comprehensive library of analytic facilities
- Update analyses and results automatically when the data change
- Open architecture design. Fully integrate your own proprietary algorithms and methods or third-party algorithms
- Fully programmable and customizable system (using the industry standard languages such as the built-in Visual Basic, C++, C#, Java, etc.). Develop highly customized data mining systems specifically tailored to your needs
- Automatically deploy solutions in seconds using built-in tools, or add automatically generated computer code for deployment (in C++, PMML) to your own programs
Data Miner in the Statistica Enterprise Server Client-Server installation
The desktop version of Statistica Data Miner is designed for the Windows environment. The Client-Server version of Statistica Data Miner is platform independent on the client side and features an Internet browser-based user interface; the server side works with all major Web server operating systems (UNIX Apache) and Wintel server computers.
- Seamless integration of desktop and Statistica Enterprise Server data mining tools: design models on one platform (desktop or Statistica Enterprise Server), execute on the other; train models on one platform (desktop or Statistica Enterprise Server) and deploy to the other platform
- Distributed processing and multi-threaded evaluation of projects. The program will automatically take advantage of multi-processor and/or multiple-server architectures, to evaluate models via multiple simultaneous processes (multithreading, distributed processing); hence the ability of Statistica Enterprise Server Data Miner installations to take full advantage of such architectures provides tremendous flexibility for scaling the system to mine even extremely large databases.
- Full flexibility of Statistica Enterprise Server: analyze data in batch mode, receive notification by email when the results are ready; share results in designated folders (repositories) with other stakeholders in the data mining projects; etc.
- Integrate input data, stakeholders, analysts, and users of results of data mining projects from any location around the world. Statistica Enterprise Server enables you to connect to data on one server (over the Internet), share analyses with other data mining professionals worldwide, and deploy solutions and results to users in even the most remote locations (e.g., to branch managers in small rural areas, engineers on remote drilling platforms, ships en-route across oceans, etc.); as long as even slow Internet access is available, you can include individuals in those locations in your data mining project)
- Ideal for teaching data mining: provide participants (students) with the option to analyze data from home or their office, wherever there is access to the Internet; allow professionals to complete assignments at the time and place that most conveniently fits their schedules.
Data Mining Tools
Statistica Data Miner offers the most comprehensive selection of statistical, exploratory, and visualization techniques available on the market, including leading edge and highly efficient neural network/machine learning and classification procedures. Also, the complete analytic functionality of Statistica is available for data mining, encapsulated in more than 300 nodes that can be selected in a structured and customizable Node Browser, and dragged into the data mining workspace.
The specialized tools for data mining are optimized for speed and efficiency and can be classified into the following five general areas (each comprising a set of Statistica modules, some of them offered only in the Statistica Data Miner environment):
General Slicer/Dicer and Drill-Down Explorer
A large number of analysis nodes are available for creating exploratory graphs, to compute descriptive statistics, tabulations, etc. These nodes can be connected to input data sources, or to all intermediate results. A specialized Statistica application module is available (Statistica Drill-Down Explorer) for interactively exploring your data by drilling down on selected variables, and categories or ranges of values in those variables. For example, you can drill-down on Gender, to display the distribution for a variable Income for females only; next you could drill down on a specific income group to explore (create graphical summaries for) selected variables for females in the selected income group only. A unique feature of Statistica Drill-Down Explorer is the ability to select and deselect drill-down variables and categories in any order; so you could next deselect variable Gender and thus display selected graphs and statistics for the selected Income group, but now for both males and females. Another unique feature of the Drill-Down Explorer is its variety of categorization (slicing) methods. Hence, the Statistica Drill-Down Explorer offers tremendous flexibility for slicing-and-dicing the data. The Statistica Drill-Down Explorer can be applied to raw data, data-base connections for in-place processing of data in remote databases, or to any intermediate result computed in a Statistica Data Miner project. See also, General Slicer/Dicer Explorer with Drill-Down.
General Classifier
Statistica Data Miner offers the widest selection of tools to perform data mining classification techniques (and build related deployable models) available on the market, including Generalized Linear Models (for binomial and multinomial responses), Classification Trees, General Classification and Regression Tree (GC&RT) modeling, general CHAID models, Cluster Analysis techniques (including large capacity implementations of tree-clustering, k-Means clustering, and EM clustering methods), and General Discriminant Analysis models (including best-subset selection of predictors). Also, the numerous advanced neural network classifiers available in Statistica Automated Neural Networks are available in Statistica Data Miner, and can be used in conjunction or competition with other classification techniques; advanced methods for unsupervised classification via k-Means or EM clustering (using modified v-fold cross-validation techniques) can also be incorporated into your General Classifier projects. See also, General Classifier (Trees and Clusters).
Deployment
Where applicable, the program includes options for generating C/C++/C# or Statistica Visual Basic, or XML syntax based PMML (Predictive Models Markup Language) code for deployment of final solutions in your custom programs; models are also automatically available for deployment after training, so all you need to do is connect new data to the special deployment node, to compute predicted classifications.
General Modeler/Multivariate Explorer
Statistica Data Miner offers the widest selection of tools to build deployable data mining models based on linear, nonlinear, or neural network techniques and tools to explore data; you can also build predictive models based on general multivariate techniques. In summary, Statistica offers the full range of techniques, from linear and nonlinear regression models, advanced generalized linear and Generalized Additive Models, to advanced neural network methods and Multivariate Adaptive Regression Splines (MARSplines). Statistica Data Miner also includes techniques that are not usually found in data mining software, such as partial least squares methods (for reducing large numbers of variables), Survival Analysis (for analyzing data containing censored observations, such as for medical research data and data from industrial reliability and quality control studies), Structural Equation Modeling techniques (to build and evaluate confirmatory linear models), Correspondence Analysis (for analyzing the structure of complex tables), Factor Analysis and Multidimensional Scaling (for exploring structure in large numbers of variables), and many others. See also, General Modeler and Multivariate Explorer.
Deployment
Where applicable, the program includes options for generating C, C++, or Statistica Visual Basic code for deployment of final solutions in your custom programs; models are also automatically available for deployment after training, so all you need to do is connect new data to the special deployment node, to compute predicted values.
General Forecaster
Statistica Data Miner includes a broad selection of traditional ( non-neural networks-based) forecasting techniques (including ARIMA, exponential smoothing with seasonal components, Fourier spectral decomposition, seasonal decomposition, regression- and polynomial lags analysis, etc.), as well as neural network methods for time series data. See also, General Forecaster.
Deployment.
Forecasts can automatically be computed for multiple models in data mining projects, and plotted in a single graph for comparative evaluation. For example, you can compute and compare predictions from multiple ARIMA models, different methods for seasonal and non-seasonal exponential smoothing, and the best time-series neural network architectures (after searching over 100 different architectures).
General Neural Networks Explorer
This tool contains the most comprehensive selection of neural network methods available on the market. This powerful component of Statistica Data Miner offers tools to approach virtually any data mining problem (including classification, hidden structure detection, and powerful forecasting). One of the unique features of the NN Explorer is the Automated Network Search (ANS) that uses Artificial Intelligence methods to help you solve the most demanding problems involved in advanced NN analysis (such as selecting the best network architecture and the best subset of variables). The Explorer offers the widest selection of cutting-edge NN architectures and procedures and highly optimized algorithms that include: Multilayer Perceptrons, Radial Basis Function Networks, Self-Organizing Feature Maps, Linear Models, Principal Components Network, and Cluster Networks. Network ensembles of these architectures can also be evaluated. Estimation methods include back propagation, conjugate gradient decent, quasi-Newton, Levenberg-Marquardt, LVQ, pruning algorithms, and more; options are available for cross validation, bootstrapping, subsampling, sensitivity analysis, etc. See also, General Neural Networks Explorer.
Deployment
Statistica Neural Networks includes code generator options to produce C/C++, and Statistica Visual Basic code for one or more trained networks as well as ensembles of networks. This code can be quickly incorporated into your own custom deployment programs. In addition, fully trained neural networks and ensembles of neural networks can be saved, to be applied later for computing predicted responses or classifications for new data. A deployment node can be dragged into the data miner workspace to perform prediction and predictive classification based on trained neural networks automatically; all you have to do (after the participating network architectures are trained) is connect the data for deployment.
Specialized Data Mining Modules
A large portion of analytic functionality used by Statistica Data Miner are driven by the computational engines of modules that are included in various other Statistica products.
- Neural networks techniques (the largest selection of architectures available, automatic problem solver tools, advanced feature selection techniques).
- All Statistica Graphics Tools and interactive exploration/visualization tools; Descriptive statistics, breakdowns, and exploratory data analysis; Frequency Tables, Crosstabulations, Tables and Stub-and-Banner Tables, Multiple Response Analysis; Nonparametric Statistics; Distribution Fitting; Power Analysis Techniques.
- General Linear Models (GLM); General Regression Models (GRM); Generalized Linear Models (GLZ); General Partial Least Squares Models (PLS); Variance Components and Mixed Model ANOVA/ANCOVA; Survival/Failure Time Analysis; General Nonlinear Estimation with Logit and Probit Regression; Log-Linear Analysis of Frequency Tables; Time Series Analysis/Forecasting; Structural Equation Modeling/Path Analysis (SEPATH).
- Cluster Analysis Techniques; Factor Analysis; Principal Components & Classification Analysis; Canonical Correlation Analysis; Reliability/Item Analysis; Classification Trees; Correspondence Analysis; Multidimensional Scaling; Discriminant Analysis; General Discriminant Analysis Models (GDA).
However, there are several modules that include selections of highly specialized data mining and data mining modeling techniques that are offered only as part of Statistica Data Miner. The following sections include technical information about these three modules.
- Feature Selection and Variable Filtering (for very large data sets)
- Mining for Association Rules
- Interactive Drill-Down Explorer
- Generalized Additive Models (GAM)
- General Classification and Regression Trees (GC&RT)
- General CHAID (Chi-square Automatic Interaction Detection) Models
- Interactive Classification and Regression Trees
- Boosted Trees
- Multivariate Adaptive Regression Splines (MAR Splines)
- Cluster Analysis (Generalized EM, k-Means & Tree)
- Goodness of Fit Computations
Feature Selection and Variable Filtering
This module will automatically select subsets of variables from extremely large data files or databases connected for streaming (Streaming Database Connector). The module can handle a practically unlimited number of variables: Literally millions of input variables can be scanned to select predictors for regression or classification. Specifically, the program includes several options for selecting variables (features) that are likely to be useful or informative in specific subsequent analyses. The unique algorithms implemented in the Feature Selection and Variable Filtering module will select continuous and categorical predictor variables that show a relationship to the continuous or categorical dependent variables of interest, regardless of whether that relationship is simple (linear) or complex (nonlinear, non-monotone).
Hence, the program does not bias the selection in favor of any particular model that you may use to find a final best rule, equation, etc. for prediction or classification. Various advanced feature selection options are also available. This module is particularly useful in conjunction with the in-place processing of data bases (without the need to copy or import the input data to the local machine), when it can be used to scan huge lists of input variables, select likely candidates that contain information relevant to the analyses of interest, and automatically select those variables for further analyses with other nodes in the data miner project. For example, a subset of variables based on an initial scan via this module can be submitted to the Statistica Neural Networks feature selection options for further review. These options allow Statistica Data Miner to handle data sets in the giga- and terabyte range. See also, the Introductory Overview on Feature Selection and Variable Filtering.
Association Rules
This module contains a complete implementation of the so-called a-priori algorithm for detecting (mining for) association rules such as customers who order product A, often also order product B or C or employees who said positive things about initiative X, also frequently complain about issue Y but are happy with issue Z (see Agrawal and Swami, 1993; Agrawal and Srikant, 1994; Han and Lakshmanan, 2001; see also Witten and Frank, 2000).
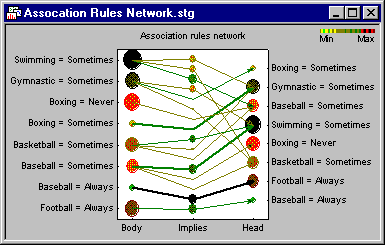
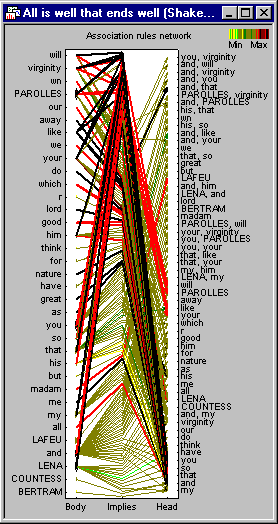
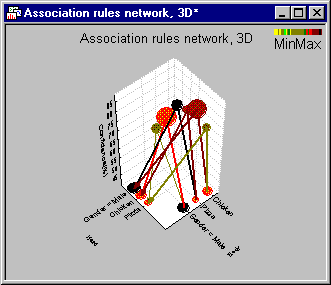
The Statistica Association Rules module can be used to process rapidly huge data sets for associations (relationships), based on predefined threshold values for detection. Specifically, the program will detect relationships or associations between specific values of categorical variables in large data sets. This is a common task in many data mining projects applied to databases containing records of customer transactions (items purchased by each customer), and also in the area of text mining. Like all modules of Statistica , data in external databases can be processed by the Statistica Association Rules module in-place database processing (see Streaming Database Connector technology), so the program is prepared to handle efficiently extremely large analysis tasks.
The results can be displayed in tables and also in unique 2D graphs:
Interactive Drill-Down Explorer
Statistica Interactive Drill-Down Explorer provides tools to flexibly explore large data sets. You can select lists of variables for drill-down; then, at each step select a specific category of the respective drill-down variable ( Female for variable Gender) to display graphs, descriptive statistics, etc. only for observations belonging to that category. In successive steps, you can further drill down by selecting categories or ranges of values for other drill-down variables (Income), and recompute the results and graphs for the respective conjunctions of categories ( Female and Medium Income, etc.).
At each step, you can also drill-up by deselecting a previously specified drill-down variable and category; drill-up and drill-down operations can be selected in any order, so for example, you could drill down in sequence on variables A, B, and C; and then drill-up on variables B, A, and C, in that order. In other words, the Statistica Interactive Drill-Down Explorer provides unlimited flexibility when combining the variables and categories (for the drill-down variables) to select subsets of data for review. Numerous options are available for defining the categories of the drill-down variables ( you can select all distinct values or text values, specify exact ranges for continuous variables, etc.), and for reviewing summary results for the respective selected subsets; the selected raw data can also be reviewed at each step. See also, the Introductory Overview on Drill-Down Explorer.
Generalized Additive Models (GAM)
The Statistica Generalized Additive Models facilities are an implementation of methods developed and popularized by Hastie and Tibshirani (1990); additional detailed discussion of these methods can also be found in Schimek (2000). The program will handle continuous and categorical predictor variables. Note that Statistica includes a comprehensive selection of methods for fitting non-linear models to data, such as the Nonlinear Estimation module, Generalized Linear Models, General Classification and Regression Trees (below), etc. See also, the Introductory Overview on Generalized Additive Models.
Distributions and link functions
The program allows you to choose from a wide variety of distributions for the dependent variable, and link functions for the effects of the predictor variables on the dependent variable:
Normal, Gamma, and Poisson distributions:
Binomial distribution:
Scatterplot smoother
The program uses the cubic spline smoother with user-defined degrees of freedom to find an optimum transformation (function) of the predictor variables.
Results statistics
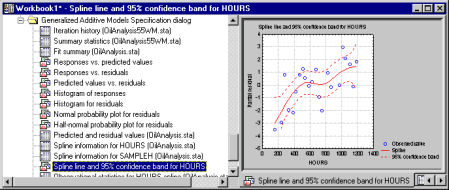
The program will report a comprehensive set of results statistics to aid in the evaluation of the model-adequacy, model fit, and interpretation of results; specifically, results include: the iteration history for the model fitting computations, summary statistics including the overall R-square value (computed from the deviance statistic) model degrees of freedom, and detailed observational statistics pertaining to the predicted response, residuals, and the smoothing of the predictor variables. Results graphs include plots of observed responses vs. residual responses, predicted values vs. residuals, histograms of observed and residual values, normal probability plots of residual values, and partial residual plots for each predictor, indicating the cubic spline smoothing fit for the final solution; for binary responses ( logit-models) lift charts can also be computed.
General Classification and Regression Trees (GC&RT)
This module is a comprehensive implementation of the methods described as CART® by Breiman, Friedman, Olshen, and Stone (1984). However, the GC&RT module contains various extensions and options that are typically not found in implementations of this algorithm, and that are particularly useful for data mining applications. Moreover, the program uses various enhancements to the basic C&RT algorithms, to dramatically increase the processing speed for large analysis problems involving categorical predictors with over 100 categories (classes). See also, the Introductory Overview on General Classification and Regression Trees.
User interface; specifying models.
In addition to standard analyses (as described by Breiman, et al.), the implementation of these methods in Statistica allow you to specify ANOVA/ANCOVA-like designs with continuous and/or categorical predictor variables, and their interactions. Three alternative user-interfaces are provided to allow you to specify such designs; these are analogous to the methods provided in GLM (General Linear Models), GLZ (Generalized Linear/Nonlinear Models), GRM (General Regression Models), GDA (General Discriminant Analysis Models), and PLS (General Partial Least Squares Models), and are described in detail in the respective sections. In short, ANOVA/ANCOVA-like predictor designs can be specified via dialog boxes, Wizards, or (design) command syntax; moreover, the command syntax is compatible across modules, so you can quickly apply identical designs to very different analyses ( compare the quality of classification using GDA vs. GTrees).
Tree pruning, selection, validation
The program provides a large number of options for controlling the building of the tree(s), the pruning of the tree(s), and the selection of the best-fitting solution. For continuous dependent (criterion) variables, pruning of the tree can be based on the variance, or on FACT-style pruning. For categorical dependent (criterion) variables, pruning of the tree can be based on misclassification errors, variance, or FACT-style pruning. You can specify the maximum number of nodes for the tree or the minimum n per node. Options are provided for validating the best decision tree, using V-fold cross validation, or by applying the decision tree to new observations in a validation sample. For categorical dependent (criterion) variables, i.e., for classification problems, various measures can be chosen to modify the algorithm and to evaluate the quality of the final classification tree: Options are provided to specify user-defined prior classification probabilities and misclassification costs; goodness-of-fit measures include the Gini measure, Chi-square, and G-Square.
Missing data and surrogate splits
Missing data values in the predictors can be handled by allowing the program to determine splits for surrogate variables (such as variables that are similar to the respective variable used for a particular split node).
ANOVA/ANCOVA-like designs
In addition to the traditional CART®-style analysis, you can combine categorical and continuous predictor variables into ANOVA/ANCOVA-like designs and perform the analysis using a design matrix for the predictors. This allows you to evaluate and compare complex predictor models, and their efficacy for prediction and classification using various analytic techniques ( GLM (General Linear Models), GLZ (Generalized Linear/Nonlinear Models), General Discriminant Analysis Models, etc.).
Tree browser
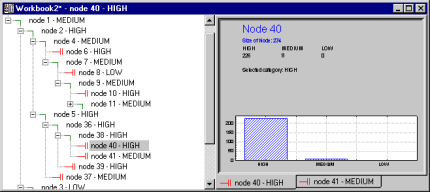
In addition to simple summary tree graphs, you can display the results trees in intuitive interactive tree-browsers that allow you to collapse or expand the nodes of the tree, and to quickly review the most salient information regarding the respective tree node or classification. For example, you can highlight (click on) a particular node in the browser-panel and immediately see the classification and misclassification rates for that particular node. The tree-browser provides a very efficient and intuitive facility for reviewing complex tree-structures, using methods that are commonly used in windows-based computer application to review hierarchically structured information. Multiple tree-browser can be displayed simultaneously, containing the final tree, and different sub-trees pruned from the larger tree, and by placing multiple browsers side-by-side it is easy to compare different tree structures and sub-trees. The Statistica Tree Browser is an important innovation to aid with the interpretation of complex decision trees.
Interactive trees review facilities (via brushing trees)
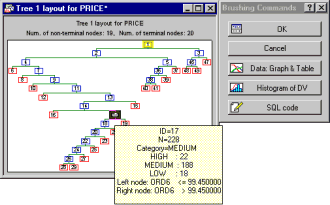
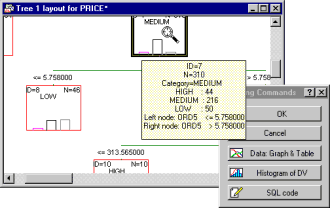
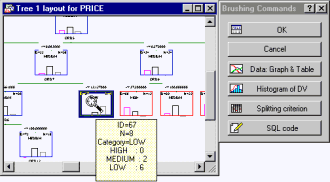
Options are also provided to review trees interactively, either using Statistica Graphics brushing tools or by placing large tree graphs into scrollable graphics windows where large graphs can be inspected behind a smaller (scrollable) window.
Results statistics
The Statistica GC&RT module provides a very large number of results options. Summary results for each node are accessible, detailed statistics are computed pertaining to classification, classification costs, gain, and so on. Unique graphical summaries are also available, including histograms (for classification problems) for each node, lift charts (for binary dependent variables), detailed summary plots for continuous dependent variables (normal probability plots, scatterplots), and parallel coordinate plots for each node, providing an efficient summary of patterns of responses for large classification problems. As in all statistical procedures of Statistica , all numerical results can be used as input for further analyses, allowing you to quickly explore and further analyze observations classified into particular nodes (you could use the GTrees module to produce an initial classification of cases, and then use best-subset selection of variables in GDA to find additional variables that may aid in the further classification).
C/C++/C#, STATISTICA Visual Basic, XML syntax based PMML, SQL Code generators
The information contained in the final tree can be quickly incorporated into your own custom programs or data base queries via the optional C/C++/C#, Statistica Visual Basic, PMML, or SQL query code generator options. The Statistica Visual Basic will be generated in form that is particularly well suited for inclusion in custom nodes for Statistica Data Miner. PMML (Predictive Models Markup Language) filed with deployment information can be used with the Rapid Deployment of Predictive Models options to compute predictions for large numbers of cases very efficiently. PMML files are fully portable, and deployment information generated via the desktop version of Statistica Data Miner can be used in Statistica Enterprise Server Data Miner ( on the server side of client-server installations), and vice versa. See also, Using C/C++/C# Code for Deployment.
General CHAID (Chi-square Automatic Interaction Detection) Models
Like the implementation of General Classification and Regression Trees (GC&RT) (described (above) in Statistica , the General CHAID module provides not only a comprehensive implementation of the original technique, but extends these methods to the analysis of ANOVA/ANCOVA - like designs. Also, like GC&RT, the program is optimized to handle large analysis problems; for example, categorical predictors with over 100 categories (classes) can be used in the analyses. See also, the Introductory Overview on General CHAID.
Standard CHAID
The CHAID analysis can be performed for both continuous and categorical dependent (criterion) variables. Numerous options are available to control the construction of hierarchical trees: the user has control over the minimum n per node, maximum number of nodes, and probabilities for splitting and for merging categories; the user can also request exhaustive searches for the best solution (Exhaustive CHAID); V-fold validation statistics can be computed to evaluate the stability of the final solution; for classification problems, user-defined misclassification costs can be specified.
ANOVA/ANCOVA-like designs
In addition to the traditional CHAID analysis, you can combine categorical and continuous predictor variables into ANOVA/ANCOVA-like designs and perform the analysis using a design matrix for the predictors. This allows you to evaluate and compare complex predictor models, and their efficacy for prediction and classification using various analytic techniques (General Linear Models, Generalized Linear Models, General Discriminant Analysis Models, General Classification and Regression Tree Models, etc.). Refer also to the description of GLM (General Linear Models), and General Classification and Regression Trees (GTrees), above, for details.
Tree browser
Like the binary results tree used to summarize binary classification and regression trees (see GC&RT), the results of the CHAID analysis can be reviewed in the Statistica Tree Browser. This unique tree browser provides a very efficient and intuitive facility for reviewing complex tree-structures and for comparing multiple tree-solutions side-by-side (in multiple tree-browsers), using methods that are commonly used in windows-based computer applications to review hierarchically structured information. The Statistica Tree Browser is an important innovation to aid with the interpretation of complex decision trees. For additional details, see also the description the tree browser in the context of the General Classification and Regression Trees (GTrees), above.
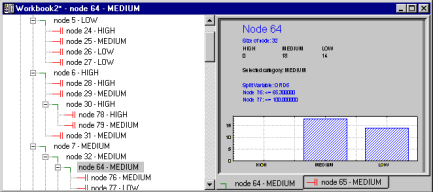
- Interactive trees review facilities (via brushing trees)
- Options are also provided to review trees interactively, either using Statistica Graphics brushing tools or by placing large tree graphs into scrollable graphics windows where large graphs can be inspected behind a smaller (scrollable) window.
Results statistics
The Statistica General CHAID Models module provides a very large number of results options. Summary results for each node are accessible, detailed statistics are computed pertaining to classification, classification costs, and so on. Unique graphical summaries are also available, including histograms (for classification problems) for each node, lift charts (for binary dependent variables), detailed summary plots for continuous dependent variables (such as, normal probability plots, scatterplots), and parallel coordinate plots for each node, providing an efficient summary of patterns of responses for large classification problems. As in all statistical procedures of Statistica , all numerical results can be used as input for further analyses, allowing you to quickly explore and further analyze observations classified into particular nodes ( you could use the GTrees module to produce an initial classification of cases, and then use best-subset selection of variables in GDA to find additional variables that may aid in the further classification).
C/C++, Statistica Visual Basic, SQL Code generators
The information contained in the final tree can be quickly incorporated into your own custom programs or data base queries via the optional C/C++, Statistica Visual Basic, or SQL query code generator options. The Statistica Visual Basic will be generated in form that is particularly well suited for inclusion in custom nodes for Statistica Data Miner.
Interactive Classification and Regression Trees
In addition to the modules for automatic tree building (General Classification and Regression Trees, General CHAID models), Statistica Data Miner also includes designated tools for building such trees interactively. You can choose either the (binary) classification and regression tree method or the CHAID method for building the (decision) tree, and at each step either grow the tree interactively (by choosing the splitting variable and splitting criterion), or automatically. When growing trees interactively, you have full control over all aspects of how to select and evaluate candidates for each split, how to categorize the range of values in predictors, etc. The highly interactive tools available for this module allow you to grow and prune-back trees, to quickly evaluate the quality of the tree for classification or regression prediction, and to compute all auxiliary statistics at each stage to fully explore the nature of each solution. This tool is extremely useful both for predictive data mining, as well as exploratory data analysis (EDA), and includes the complete set of options for automatic deployment, for the prediction or predicted classification of new observations (see also the description of these options in the context of CHAID and the General Classification and Regression Trees modules).
Boosted Trees
The most recent research on statistical and machine learning algorithms suggests that for some difficult estimation and prediction (predicted classification) tasks, using successively boosted simple trees (see also boosting) can yield more accurate predictions than neural network architectures or complex single trees alone. Statistica Data Miner includes an advanced Boosted Trees module for applying this technique to predictive data mining tasks. The user has control over all aspects of the estimation procedure and detailed summaries of each stage of the estimation procedures are provided so that the progress over successive steps can be monitored and evaluated. The results include most of the standard summary statistics for classification and regression computed by the General Classification and Regression Trees module. Automatic methods for deployment of the final boosted tree solution for classification or regression prediction are also provided.
MARSplines
The Statistica MARSplines (Multivariate Adaptive Regression Splines) module is a complete implementation of this technique, originally propose by Friedman (1991; Multivariate Adaptive Regression Splines, Annals of Statistics, 19, 1-141). The program, which in terms of its functionality can be considered a generalization and modification of stepwise Multiple Regression and Classification and Regression Trees (GC&RT), is specifically designed (optimized) for processing very large data sets, and also features advanced precision optimizations. A large number of results options and extended diagnostics are available to allow you to evaluate numerically and graphically the quality of the MARSplines solution.
Cluster Analysis (Generalized EM, k-Means & Tree)
The Statistica Cluster Analysis (Generalized EM, k-Means & Tree) module is an extension of the techniques available in the general StatisticaCluster Analysis module, specifically designed to handle large data sets, and to allow clustering of continuous and/or categorical variables. The advanced EM clustering technique available in this module is sometimes referred to as probability-based clustering or statistical clustering. The program will cluster observations based on continuous and categorical variables, assuming different distributions for the variables in the analyses (as specified by the user). Various cross-validation options are provided to allow the user to choose and evaluate a best final solution for the clustering problem, and detailed classification statistics are computed for each observation. These methods are optimized to handle very large data sets, and various results are provided to facilitate subsequent analyses using the assignment of observations to clusters. Options for deploying cluster solutions, for classifying new observations, are also included.
Goodness of Fit Computations
The Statistica Goodness of Fit module will compute various goodness of fit statistics for continuous and categorical response variables (for regression and classification problems). This module is specifically designed for data mining applications to be included in "competitive evaluation of models" projects as a tool to choose the best solution. The program uses as input the predicted values or classifications as computed from any of the Statistica modules for regression and classification, and computes a wide selection fit statistics as well as graphical summaries for each fitted response or classification. Goodness of fit statistics for continuous responses include least squares deviation (LSD), average deviation, relative squared error, relative absolute error, and the correlation coefficient. For classification problems (for categorical response variables), the program will compute Chi-square, G-square (maximum likelihood chi-square), percent disagreement (misclassification rate), quadratic loss, and information loss statistics. See also, Goodness of Fit Computations.

