Axis: Title
The options described here are for the title associated with each axis. These options are available on the Axis: Title tab of the Graph Options dialog box.
Separate options are available for each graph axis and the changes that you make for each axis are independent of one another (unless any of the Copy to options are selected to transfer the settings to other axes, see below). Therefore, the following descriptions of the scale options will apply to each axis in the graph.
- Axis
- Although all of the options are the same for each axis, you can make changes to each axis independently of the other. Select here the axis (X, Y-left, Y-right, or Top axis for 2D graphs, X, Y, or Z axes for 3D graphs, or X, Y, Z, or V axes for triangular axis surface graphs) to which you want to make changes.
- Copy axis specs to
- Instead of manually selecting the same specifications for each of the axes, click this button to display the Copy axis specs to dialog box, which contains options to automatically copy to the remaining axes.
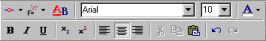
- Mini-formatting toolbar
- The Mini-formatting toolbar provides quick access to options for customizing the axis title.
Using these buttons, you can easily specify font type and style, add superscripts and subscripts, change the font attributes to bold or italics, etc. You can place legend symbols in titles by clicking the legend button
 . You can include fits or functions in titles by clicking the fit button
  . You can horizontally align X-axis titles (or vertically align Y-axis titles) by clicking the Flush Left
  , Center
  , or Flush Right
  button. A listing and brief description of each of these mini-formatting toolbar buttons is available in Mini-Formatting Toolbar.
 - Support for F4
- To simplify the process of editing graph display features (e.g., font color, point markers, area patterns), STATISTICA provides support for the F4 key on your keyboard. This means that you can repeat the last command you performed in the graph. For example, if you have just changed the title font to Arial, 12pt, Italic, and you want to make the same change to the axis titles, simply highlight the axis title you want to update, and press F4. Note that the F4 buffer is graph specific. If you switch to a different graph and press F4, you will repeat the last action performed on that graph.
- Title
- Type the axis title in the edit box provided. Any legends, fits, or functions added to the title will be shown in this box as will any formatting changes you make using the options on the Formatting mini-toolbar.
Display Axis Title. Select this check box to display the axis title shown in the Title box. If you do not want a title, clear this check box.
Disconnect object(s) from graph. There are two different types of text in graphs. The first is normal editable text that you can change. The second is text that is automatically created and updated by STATISTICA, (e.g., graph legends, functions, statistics). This second type of text (and/or symbols) consists of separate "active objects" (e.g., the point marker symbol in a legend) that are automatically updated by STATISTICA. You can always insert new text in between active objects. You can also selectively disconnect any active object from auto updating and therefore be able to edit it (but, of course, cancel the auto-updating feature) by clicking the Disconnect object(s) from graph button.