Example 4: Exhaustive Search for Univariate Splits for Ordered Predictors
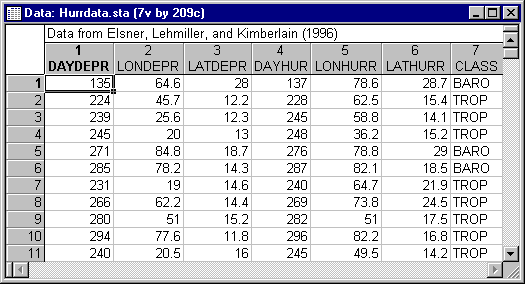
This example is based on a data file discussed in Elsner, Lehmiller, and Kimberlain (1996). Historically, Atlantic hurricanes are classified on the dependent variable Class as having formed from either tropical-only (Trop) or baroclinically-influenced (Baro) sources. The six independent variables are the (Julian) dates, longitudes, and latitudes of where the storms first achieved tropical depression and then when the storm achieved hurricane status. A portion of the data set is shown below. The complete data file containing 209 cases is available in Hurrdata.sta. Open this data file via the File - Open Examples menu; it is in the Datasets folder.
Specifying the analysis
For this example, we will perform an analysis similar to the analysis reported by Elsner et al. (1996). Select Classification Trees from the Statistics - Multivariate Exploratory Techniques menu to display the Classification Trees Startup Panel. On the Quick tab, select the Variables button to display the standard variable selection dialog. Here, select Class as the Dependent variable, the six independent variables as the Ordered predictors, and then click the OK button. On the Methods tab, select the C&RT-style exhaustive search for univariate splits option button under Split selection method. Then on the Stopping options tab, select the FACT-style direct stopping option button under Stopping rule. Also, enter .1 in the Fraction of objects field under Stopping parameters. Finally, click the OK button on the Classification Trees Startup Panel to first briefly display the Parameter Estimation dialog (from which you can monitor the progress of the classification tree computations) and then the Classification Trees Results dialog when the computations are completed.
Reviewing the results
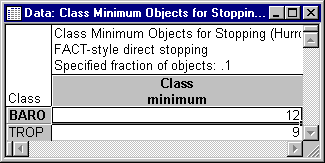
The FACT-style direct stopping option uses the value specified for the Fraction of objects to determine when to stop splitting. This example uses a value of .10, so click the Class minimum objects button on the Predicted classes tab to display the spreadsheet showing the resulting minimum class sizes to stop splitting.
The values of 9 and 12 for Trop and Baro, respectively, means that splitting stopped when all terminal nodes were "pure" or contained no more than 9 Trop cases or 12 Baro cases. You can confirm this by clicking the Summary: Tree structure button on the Quick tab to display the Tree structure spreadsheet.
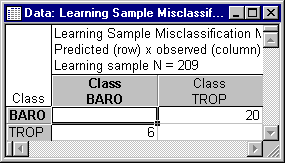
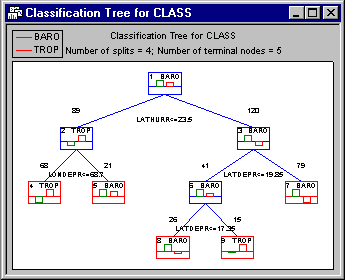
The selected "right-sized" tree is described numerically by the information in the Tree structure spreadsheet. Inspecting the n's in the n in cls columns shows the tree has 4 splits and 5 terminal nodes, and misclassifies 6 Baro hurricanes (2 in Node 4 and 4 in Node 9) and 20 Trop hurricanes (10 in Node 5, 4 in Node 7, and 6 in Node 8).
Click the Misclassification matrix button on the Predicted classes tab. The overall misclassification rate is 26 misclassified cases divided by 209 total cases = 12.4%.
The tree can also be displayed graphically by clicking the Classification tree plot button on the Quick tab.
See also Classification Trees - Index.


