Example 5: Analyzing a Nested Mixed Model
The data for this example were taken from Milliken and Johnson, figure 30.2. A comfort experiment was conducted to study the effects of temperature and gender on a person’s comfort. Researchers were interested only in three temperature settings: 65, 70, and 75 degrees Fahrenheit. Each temperature setting was randomly assigned to three of nine available environmental chambers. Eighteen males and eighteen females were randomly assigned to chambers so that two males and two females were assigned to each of the nine chambers. After the people were subjected to the environmental condition for three hours, their comfort was measured.
The data for this example are in the STATISTICA example data file Comfort2.sta. Open this data file via the File - Open Examples menu; it is in the Datasets folder. A portion of this file is shown below:

- Selecting the variables
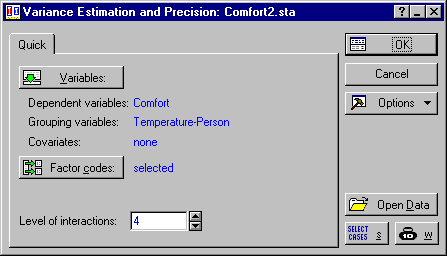
- To start the analysis, select Variance Estimation and Precision from the Statistics menu to display the
Variance Estimation and Precision Startup Panel. On the Quick tab, click the Variables button to display the standard variable selection dialog. Here, select variable Comfort as the Dependent variable and variables Temperature, Chamber, Gender, and Person as Grouping variables, then click the OK button. You can leave Level of interactions at its default because we will be specifying a custom design on the next dialog.
Click OK again to display the Define/Review Model dialog. On this dialog, select ANOVA as the Estimating method, and select Type I as the Sum of squares type. Next we want to specify a custom design:
Comfort = Temperature + Gender + Temperature*Gender + Chamber(Temperature) + Person(Chamber) + error
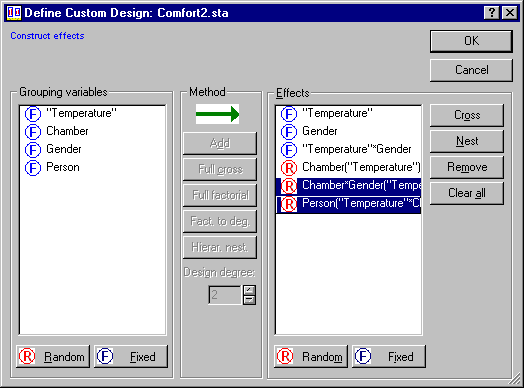
Click Customize design to display the Define Custom Design dialog. In the Effects pane, highlight Chamber*Gender("Temperature") and Person("Temperature"*Chamber*Gender).
Then click the Remove button to the right of the pane. All the highlighted effects will be removed.
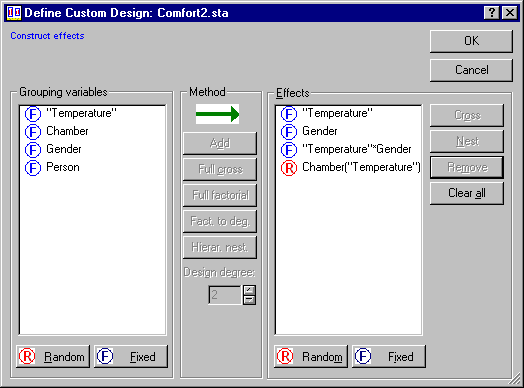
Next, in the Grouping variables pane, select Person and click the Hierar. nest button. In the Nesting for Between-Group Factors dialog, select Chamber and click OK. Person(Chamber) will be added to the Effects pane. Select this term and click the Random button.
Click OK to return to the Define/Review Model dialog. Then click OK again to display the Variance Estimation and Precision Results dialog.
- Summary ANOVA table
- On the
Summary tab, click the ANOVA table button to display the summary ANOVA table for the analysis.
This table summarizes the main results of the analysis.