Boosted Trees Results - Quick Tab
Select the Quick tab of the Boosted Trees Results dialog to access options to review the most important results statistics and graphs for the current analysis. The options available on this tab depend on the Type of analysis selected on the Boosted Trees Startup Panel - Quick tab, i.e., whether the current analysis is a Classification Analysis or Regression Analysis.

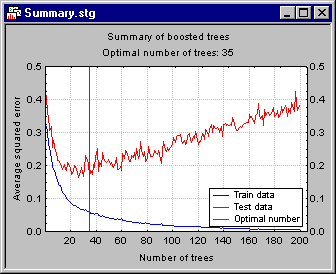
The graph will also indicate the particular number of trees (boosting steps) that resulted in the lowest average squared error. That solution is likely near the prediction model with the best predictive validity. By default, this will be the solution that is selected into the Number of trees field on the Boosted Trees Results dialog.
During the building of each tree, for each split, predictor statistics (i.e., sums of squares regression, since simple regression trees are built in all cases) are computed for each predictor variable; the best predictor variable (yielding the best split at the respective node) will then be chosen for the actual split. The program also computes the average of the predictor statistic for all variables over all splits and over all trees in the boosting sequence. The final predictor importance values are computing by normalizing those averages so that the highest average is assigned the value of 1, and the importance of all other predictors is expressed in terms of the relative magnitudes of the average values of the predictor statistic, relative to the most important predictor.