Example 1: Stepwise Regression
This example illustrates model building in GRM using backward stepwise regression. The data for this example is available in the Tomatoes.sta data file. The design is a 5-way mixed-level fractional-factorial design with both 2- and 3-level categorical predictor variables. All main and 2-way interaction effects are estimable for this design (see the GLM module Advanced Example: Type V Sums of Squares). A description of the variables in the data set can be found in the Experimental Design module example Designing and Analyzing a 23, 32 Experiment. Refer also to the Mixed 2 and 3 Level Designs topic for additional details concerning these types of designs.
Ribbon bar. Select the Home tab. In the File group, click the Open arrow and select Open Examples to display the Open a Statistica Data File dialog. Open the data file, which is located in the Datasets folder. Then, select the Statistics tab. In the Advanced/Multivariate group, click Advanced Models and from the menu, select General Regression to display the General Regression Models Startup Panel.
Classic menus. From the File menu, select Open Examples to display the Open a Statistica Data File dialog. Open the data file, which is located in the Datasets folder. Then, from the Statistics - Advanced Linear/Nonlinear Models submenu, select General Regression Models to display the General Regression Models Startup Panel.
Select Factorial ANOVA as the Type of analysis and Quick specs dialog as the Specification method. Then click the OK button to display the GRM Factorial ANOVA Quick specs dialog.
On the Quick tab, click the Variables button to display the standard variable selection dialog. Select Pounds from the Dependent variable list, and select Soil Condition, Potsize, Variety, Production Method, and Location as the Categorical predictors (factors). Then, click the OK button.
For this example, we will force the main effects into the model and limit the search to the best submodel, including additional two-way interactions, if any such submodel is better than the main effects only submodel. Specify a factorial design to degree 2 so that the whole model includes all main and 2-way interaction effects. To do this, on the Quick tab of the GRM Factorial ANOVA dialog, click the Between effects button to display the GLM Between Effects dialog. Select the Use factorial design to specified degree option button, enter 2 in the degree field, and then click the OK button.
Now, select the Options tab. Select the Backward stepwise option button. Enter 5 effects to be forced into the model (i.e., the 5 main effects) in the Effects to force field, specify .10 as the critical p value for entry into the model (p1, enter field), and .10 as the critical p value for removal from the model (p2, remove field). The remainder of the specifications for this analysis can use the default specifications. Therefore, click the OK button to display the GRM Results dialog.
If you want to run this example using GRM Syntax, you can run the following syntax program from the GRM Analysis Syntax Editor (see Methods for specifying designs).
The syntax program for the analysis is:

Select the Summary tab. Click the Univar. results button to produce the Univariate Tests of Significance for Pounds spreadsheet, which shows the summary ANOVA table for the final model.

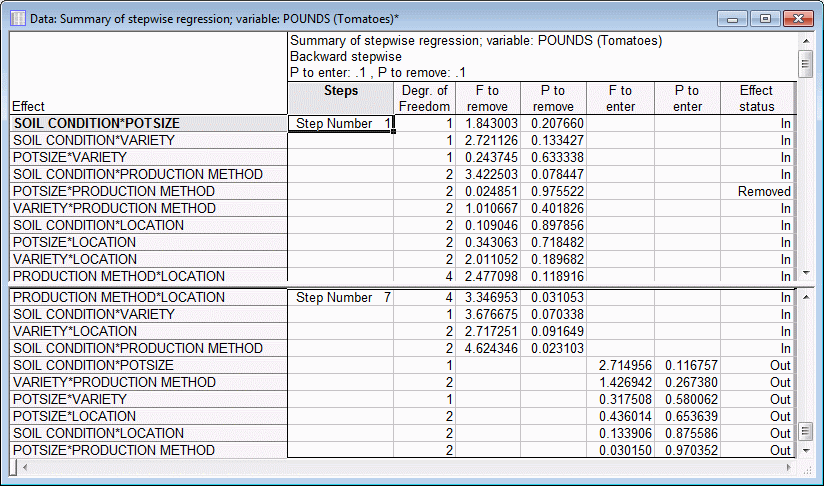
It appears that only 4 of the 2-way interactions improve the prediction of the outcome as compared to the main effects only model.
See also, GRM - Index.