GC&RT Results - Summary Tab
Select the Summary tab of the GC&RT Results dialog to access options to review the main results of the C&RT analysis (classification). Note that by default Statistica initially selects the last (and usually most complex) tree that was computed, unless some of the cross-validation options were selected (see the Introductory Overview). Unless previously selected while specifying the current analysis, you can click the V-fold cross-validation & tree sequence button to perform the V-fold cross-validation to choose a best (right-size) tree.
 Denotes a split node
 Denotes a terminal node
This browser provides a complete summary of the results and, thus, you can efficiently review even the most complex trees (see also Reviewing Large Trees: Unique Analysis Management Tools in the GC&RT Introductory Overview - Basic Ideas Part II). However, the results displayed differ, depending upon whether the selected response variable was categorical or continuous.
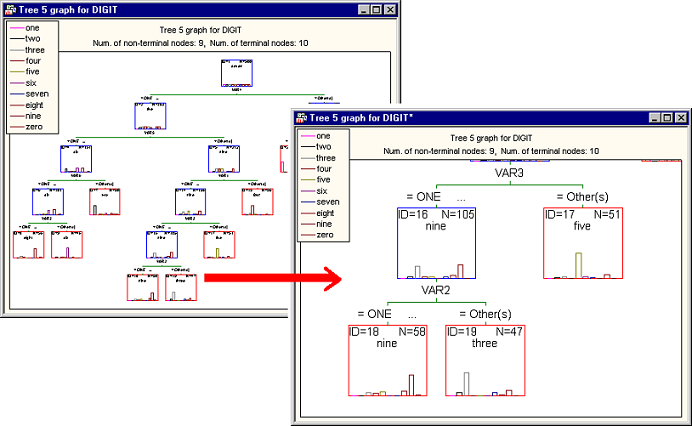
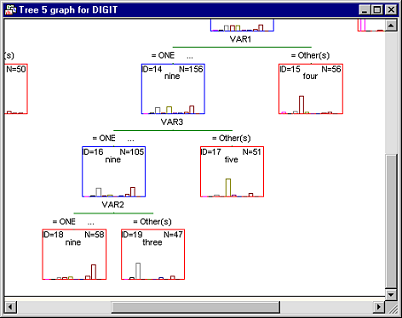
Results for categorical dependent variable (classification). If you selected a categorical response variable (classification-type analysis; see the Introductory Overview), clicking on a node in the tree browser will produce a graph displaying the number of cases in each category of the variable as well as the histogram of statistics for the selected node.
Results for continuous dependent variable (regression). If you selected a continuous response variable (regression-type analysis; see the Introductory Overview ), clicking on a node in the tree browser will produce a graph displaying the mean and variance of the variable as well as the plot of normal density with these parameters for the selected node.
These tools allow you to review all details of large and complex tree graphs.
For reviewing large trees, you can also use the Scrollable Tree or Workbook Tree Browser facilities, which are particularly well suited for browsing the information contained in complex regression or classification trees.
In a sense, this option will display a very large graph that can be reviewed (scrolled) behind a (resizable) window. Note that all standard graphics editing, zooming, etc. tools for customization and reviewing further details of the graph are still available for this method of display.

If you move the crosshair over a node, a ToolTip pops up displaying detailed summary statistics for the respective node. To select a node, click it; you can then select the desired action for that node from the
Brushing Commands dialog or the shortcut menu, which contain identical options. For descriptions of the options available for each node, see the
Node
Exit the Brushing tree mode by clicking Cancel in the Brushing Commands dialog.
- The node IDs of child nodes to which cases or objects are sent, depending on whether they satisfy (left branch), or do not satisfy (right branch) the split condition at a split node.
- The number of cases or objects belonging to the node.
- Information detailing the Split condition for a split node. Note that no child nodes or split conditions are displayed for the terminal nodes of the tree.
If you selected a categorical response variable (classification), then, in addition to the information described above the tree structure will include the number of cases or objects in each observed class that are sent to the node. Alternatively, in the case of a continuous response (regression) the tree structure will contain information about the mean and variance of the dependent variable for the cases or objects belonging to the node.
For classification problems (categorical dependent variable), the spreadsheet shows the number of cases or objects in each observed class that are sent to the node; a Gain value is also reported. By default (with Profit equal to 1.0 for each dependent variable class), the gain value is simply the total number of observations (cases) in the respective node. If separate Profit values are specified for each dependent variable class, then the Gain value is computed as the total profit (number of cases times respective profit values).
For regression problems (continuous dependent variable), the spreadsheet shows the number of cases or objects in each observed class that are sent to the node, and the respective node mean and variance.
If you performed v-fold cross-validation to select a right-sized tree, the spreadsheet will contain the number of terminal nodes, the CV cost, its standard error, the resubstitution cost, and the node complexity for each pruned tree. However, if you did not opt for the v-fold cross-validation, the spreadsheet would still contain the number of terminal nodes, the resubstitution cost, and the node complexity for each pruned tree and omit CV cost and standard error. The pruned tree selected as the right-sized tree is marked with an asterisk.
If you selected FACT-style direct stopping as the Stopping rule for the analysis, the number of terminal nodes, the resubstitution cost, and the node complexity will be shown for the selected single tree.

Advanced
tab options for details), so it is possible for a variable to be important, even though it might not have been used for any split. Refer to the discussion in Breiman (1984) for details. See also, Predictor Importance in Statistica GC&RT, Interactive Trees, and Boosted Trees.
Advanced
tab), this spreadsheet will show the two levels of the respective factors that were contrasted in each column of the design matrix; if the overparameterized model was used, then the spreadsheet will show the relationship of each level of the categorical predictors to the columns in the design matrix (and, hence, the respective parameter estimates).Specifications for v-fold cross-validation include: Seed for random number generator, V-fold cross-validation; v-value, and Standard error rule. These values will be used to control the sampling that Statistica performs to obtain cross-validation error estimates. See also the Introductory Overview for details.
The Standard error rule is applied as follows. Find the pruned tree in the tree sequence with the smallest CV cost. Call this value Min. CV, and call the standard error of the CV cost for this tree Min. Standard error. Then select as the right-sized tree the pruned tree in the tree sequence with the fewest terminal nodes that has a CV cost no greater than Min. CV plus the Standard error rule times Min. Standard error. A smaller (closer to zero) value for the Standard error rule generally results in the selection of a right-sized tree that is only slightly simpler (in terms of the number of terminal nodes) than the minimum CV cost tree. A larger (much greater than zero) value for the Standard error rule generally results in the selection of a right-sized tree that is much simpler (in terms of the number of terminal nodes) than the minimum CV cost tree. Thus, cost/complexity pruning, as implemented in the selection of the right-sized tree, makes use of the basic scientific principles of parsimony and replication: Choose as the best theory the simplest theory (i.e., the pruned tree with the fewest terminal nodes) that is consistent with (i.e., has a CV cost no greater than Min. CV plus Standard error rule times Min. SE ) the theory best supported by independent tests (i.e., the pruned tree with the smallest CV cost).