This chapter describes the tools and approach to monitoring StreamBase® applications.
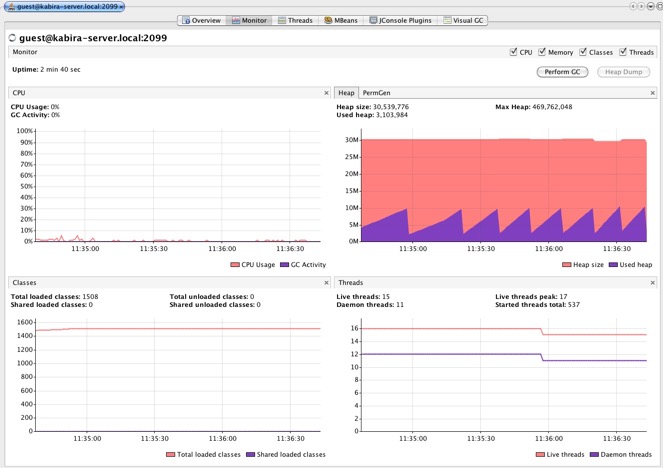
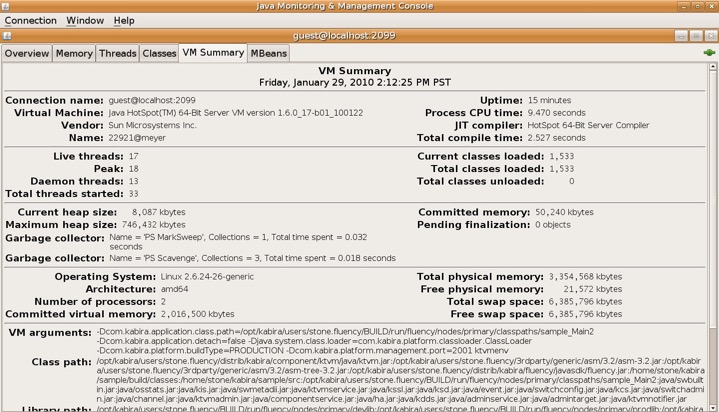
Standard Java tools may be used to monitor the JVM.
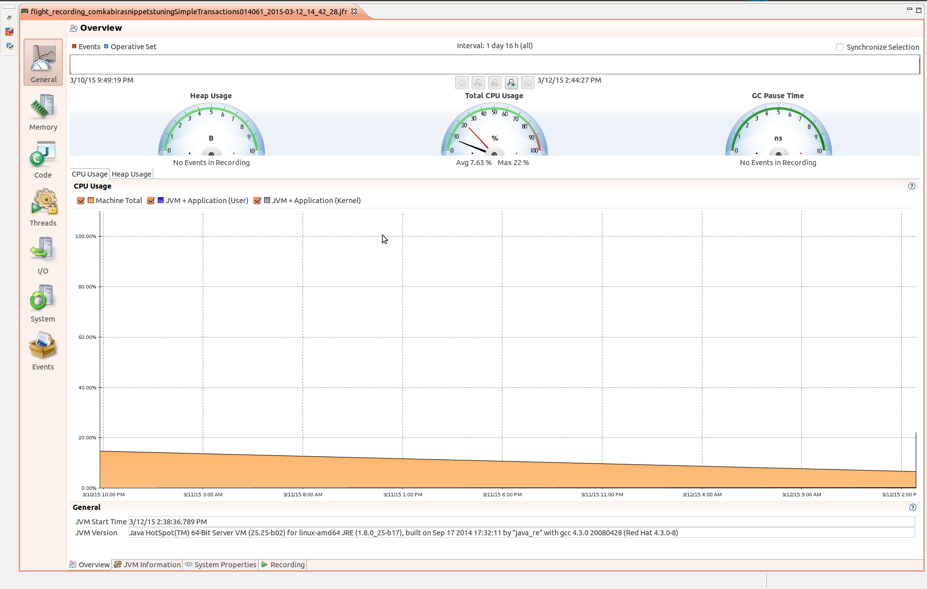
Flight Recorder - If using Oracle Java 7 or later, Java Mission Control and Flight Recorder is a built-in, low overhead tool for collecting JVM diagnostic and profiling data.
To enable (but not start) add the following VM deploy options:
-XX:+UnlockCommercialFeatures
                                 -XX:+FlightRecorder
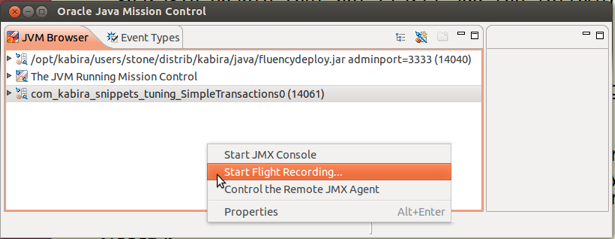
The related GUI tool is Java Mission Control, jmc. Once the application is started your test run, you can select your JVM in mission control, select flight recorder and start recording.
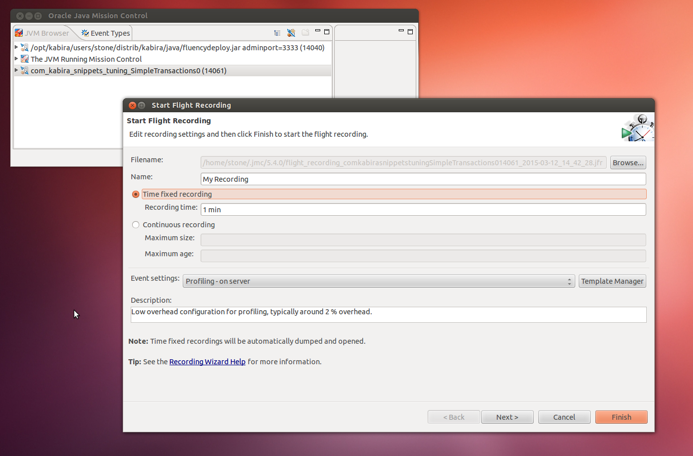
Once the capture is finished, mission control enables exploring the captured data.
Recording from the command line may be done with the
jcmd command. See the jcmd manual page from the JDK,
or Oracle online documentation for details.
You can generate a variety of reports using epadmin display statistics, which apply to an entire node. A complete list of the available statistics is shown in the epadmin statistics command reference.
Display deadlock details.
epadmin <network-address> display statistics --statistics=deadlock

                          Deadlocks :     2466
                  Deadlock Backoffs :     2435
Minimum Backoff Time (milliseconds) :      100
Maximum Backoff Time (milliseconds) :    10000
Average Backoff Time (milliseconds) : 4330.3-
Deadlocks - number of deadlocks.
-
Deadlock Backoffs - number deadlock back-offs.
-
Minimum Backoff Time (milliseconds) - minimum back-off time in milliseconds.
-
Maximum Backoff Time (milliseconds) - maximum back-off time in milliseconds.
-
Average Backoff Time (milliseconds) - average back-off time in milliseconds.
The classtransform statistic shows per-JVM
information about the number of classes rewritten at load time. These
statistics are available for all running JVMs in the node.
epadmin <network-address> display statistics --statistics=classtransform

      Action   Calls      Total    Average    Minimum    Maximum JVM name
                       Seconds  Microseconds.................
        skip    3528      0.001        0.2        0.0        5.7 System::administration
no-transform    6106      1.104      180.8        1.6    19505.0 System::administration
   transform     390      1.950     4999.0       37.1   210325.2 System::administration
        skip    5579      0.003        0.5        0.0       30.9 application::sbc-data
no-transform   46502      5.582      120.0        1.5   263751.4 application::sbc-data
   transform     388      0.979     2524.1       43.0   167035.2 application::sbc-data
-
Action - action taken by the class transformer.
-
skip- the class was in the skip packages list and not examined. -
no-transform- the class was examined and no transformations were required. -
transform- the class was transformed.
-
-
Calls - number of calls made (classes passed) to the class transformer since the last time this statistic was cleared.
-
Total Seconds - total number of seconds spent in the class transformer since the last time this statistic was cleared.
-
Average Microseconds - average number of microseconds per call to the class transformer since the last time this statistic was cleared.
-
Minimum Microseconds - minimum number of microseconds spent in a call to the class transformer since the last time this statistic was cleared.
-
Maximum Microseconds - maximum number of microseconds spent in a call to the class transformer since the last time this statistic was cleared.
-
JVM name - name of the JVM.
The classtypedescriptor statistic shows per-JVM
information about the system type descriptor meta-data created for
loaded managed classes and enumerations. The collection of class type
descriptor statistics imposes a slight performance penalty and is not
enabled by default.
When collected, these statistics are available for all running JVMs.
epadmin <network-address> display statistics --statistics=classtypedescriptor

Engine Microseconds   Dup #Fields #Methods #Params Class
hello0    25009.545  true       2       62     261 com.tibco.ep.sb.ads.internal.Node
hello0    19867.623  true       8       22      18 com.kabira.platform.management.Target
...
-
Engine - name of the JVM.
-
Microseconds - number of microseconds used to create type descriptors for the class.
-
Dup - whether this type descriptor has already been created by another running JVM.
-
#Fields - number of non-static fields in the class.
-
#Methods - number of non-static methods in the class.
-
#Params - total number of parameters used by all methods in the class.
-
Class - Name of the class.
Show node and engine startup and shutdown event records.
These statistics are always available, but may be cleared.
epadmin <network-address> display statistics --statistics=lifecycle

 Time         Milliseconds Engine     Event               Message
 12:38:35.422           76  720944343 Engine Start        System::swcoordadmin
 12:38:35.777            2 1568875692 JVM Initialize
 12:38:36.203           19 1568875692 Component Load      HOCON parser
 12:38:36.311          108 1568875692 Component Load      DTM, StreamBase, and LDM Security Configuration
 12:38:36.397           85 1568875692 Component Load      Administration Service Framework
 12:38:36.469           72 1568875692 Component Load      Configuration Target
...
-
Time - Timestamp for when the event occurred.
-
Milliseconds - Milliseconds used by the event.
-
Engine - An engine instance identifier. This can be mapped to any engine name by looking for
Engine Startevent with a matching identifier in theEnginecolumn. The engine name is found in theMessagecolumn.The engine name mapping may also be found by running the
enginereport. See Node Monitoring. -
Event - The event type. Most events come in begin/end pairs.
-
Message - A message associated with the event.
Internally, life cycle events come in begin/end pairs. The default
report (--detailed false only shows the end events,
collected when each life cycle event completes. Adding the
--detailed true option causes all events to be
displayed. Begin events have no entry in the
Milliseconds column.
Display a list of the application and node processes running in a node.
epadmin <network-address> display statistics --statistics=engine

    ID          Build Type  Contains JVM        State                          Engine Name
720944343       PRODUCTION            NO      running                 System::swcoordadmin
1568875692      PRODUCTION           YES      running               System::administration
3797164929 PRODUCTION YES running application::sbc-data-
ID - node-unique identifier for the process.
-
Build Type - whether the process contains
PRODUCTIONbinaries orDEVELOPMENT(debug) binaries. -
Contains JVM - whether this process contains a Java VM.
-
State - whether the process is
runningorstopped. -
Engine Name - process name.
Display details on the objects stored in transactional memory.
epadmin <network-address> display statistics --statistics=object

 Cardinality      Creates     Destroys Class
           2            2            0 com.kabira.platform.Metadii
           2            2            0 com.kabira.platform.component.NodeNotifier
           0           54           54 com.kabira.platform.Reference$Sprite
           1            1            0 com.tibco.ep.dtm.discovery.publish.KubernetesBridge
           2            2            0 com.tibco.ep.dtm.configuration.hocon.parser.HoconParser
           2            2            0 com.tibco.ep.security.dtm.realm.local.LocalPrincipal
           2            2            0 com.tibco.ep.security.dtm.realm.local.UserDirectedTargetParameter
...-
Cardinality - current number of objects in transactional memory.
-
Creates - total number of creates.
-
Destroys - total number of destroys.
-
Class - type name.
Display details on the queries executed against query tables in transactional memory.
epadmin <network-address> display statistics --statistics=navigation

Select  Cluster Query Cluster Extent      Iteration     # Iterated    Cardinality Class/Key Name
    43              2              0              0              0              0 session.RedundantRelationQT::Primary
   499             23              0              0              0              0 session.RedundantStoreQT::Primary
     0              0              0           4404              0              0 session.RedundantStoreQT::Secondary_1
     0              0              0              0              0             10 session.RedundantStoreQT
...-
Select - number of unique key queries.
-
Cluster Query - number of queries that could not be resolved on the local node.
-
Cluster Extent - number of cluster-wide extent queries.
-
Iteration - number of non-unique key queries.
-
# Iterated - total number of rows returned by non-unique key queries.
-
Cardinality - number of times cardinality was called on a query table.
-
Class/Key Name - query table or query table key names in transactional memory.
The javatransaction statistic shows details on
all transactions initiated by a Streaming application. The collection of
transaction statistics imposes a slight performance penalty and are not
enabled by default.
epadmin <network-address> display statistics --statistics=javatransaction

   Number of     Latency (milliseconds)  Prepare (milliseconds) Commit (milliseconds)
Transactions  average      min      max  average    min    max  average    min    max Deadlocks Rollbacks Exceptions Name
         218     0.18     0.01     6.04     0.00   0.00   0.00     0.00   0.00   0.00         0         0          0 Region:charging.ChargingFunctionDispatcher:0
          46     0.02     0.01     0.03     0.00   0.00   0.00     0.00   0.00   0.00         0         0          0 Low memory check
           0     0.00     0.00     0.00     -nan   0.00   0.00     -nan   0.00   0.00         5         0          0 Region:charging.ChargingFunctionDispatcher:1.ChargingFunction.charging.Initial.default.PreChargingSessionControl.default.CreateSession.default.Create.CreateSession.default.SessionStorageExtension.ISessionStorageType.Storage.StorageOperations
         453     0.03     0.00     0.11     0.00   0.00   0.00     0.00   0.00   0.00         0         0          0 Region:charging
          25     0.40     0.25     0.56     0.00   0.00   0.00     0.00   0.00   0.00         0         0          0 Region:charging.NetworkOutbound.Ro.Outbound.client-ctf-ro.CollectOutboundMetrics.default
           9    20.76    20.03    21.86     0.00   0.00   0.00     0.00   0.00   0.00         0         0          0 Collect statistics
           1     0.10     0.10     0.10     0.00   0.00   0.00     0.00   0.00   0.00         0         0          0 Region:charging.ChargingFunctionDispatcher:5.ChargingFunction.charging.Update.default.UserNotifications.ExternalNotification
... -
Number of Transactions - number of transactions.
-
Latency (milliseconds) - average - average transaction latency.
-
Latency (milliseconds) - min - minimum transaction latency.
-
Latency (milliseconds) - max - maximum transaction latency.
-
Prepare (milliseconds) - average - average prepare phase latency.
-
Prepare (milliseconds) - min - minimum prepare phase latency.
-
Prepare (milliseconds) - max - maximum prepare phase latency.
-
Commit (milliseconds) - average - average commit phase latency.
-
Commit (milliseconds) - min - minimum commit phase latency.
-
Commit (milliseconds) - max - maximum commit phase latency.
-
Deadlocks - number of deadlocks
-
Rollbacks - number of rollbacks.
-
Exceptions - number of not handled exceptions.
-
Name - name of execution context that initiated transaction.
The javatransaction statistic supports a
detailed view of the latency for each named transaction. A histogram of
the total number of transactions, sorted by latency, is displayed below
the summary transaction information, where the Latency, Prepare, and Commit summary values correspond to the Total Latency, Prepare
Latency, and Commit Latency
histograms.
epadmin <network-address> display statistics --statistics=javatransaction --detailed

   Number of     Latency (milliseconds)  Prepare (milliseconds) Commit (milliseconds)
Transactions  average      min      max  average    min    max  average    min    max Deadlocks Rollbacks Exceptions Name
         443     0.05     0.01     0.17     0.00   0.00   0.00     0.00   0.00   0.08         0         0          0 Low memory check
Total Latency (microsecond)                                              Total
       1                                                                     0
       2                                                                     0
       4                                                                     0
       8                                                                     1
      16  XXX                                                               27
      32  XXXXX                                                             37
      64  XXXXXXXXXXXXXXXXXXXXXXXXXXXXXXXXXXXXXXXXXXXXXXX                  334
     128  XXXXXX                                                            42
     256                                                                     2
     512                                                                     0
    1024                                                                     0
    2048                                                                     0
    4096                                                                     0
    8192                                                                     0
   16384                                                                     0
   32768                                                                     0
Prepare Latency (microsecond)                                            Total
       1  XXXXXXXXXXXXXXXXXXXXXXXXXXXXXXXXXXXXXXXXXXXX                     443
       2                                                                     0
       4                                                                     0
       8                                                                     0
      16                                                                     0
      32                                                                     0
      64                                                                     0
     128                                                                     0
     256                                                                     0
     512                                                                     0
    1024                                                                     0
    2048                                                                     0
    4096                                                                     0
    8192                                                                     0
   16384                                                                     0
   32768                                                                     0
Commit Latency (microsecond)                                             Total
       1  XXXXXXXXXXX                                                       56
       2  XXXXX                                                             28
       4  XXXXXXXXXXXXXXXXXXXXXXXXXXXXXXXXXXXXXXXXXX                       211
       8  XXXXXXXXXXXXXXXXXXXXXXXXXX                                       134
      16  XX                                                                10
      32                                                                     3
      64                                                                     0
     128                                                                     1
     256                                                                     0
     512                                                                     0
    1024                                                                     0
    2048                                                                     0
    4096                                                                     0
    8192                                                                     0
   16384                                                                     0
   32768                                                                     0
...-
Total Latency (microseconds) - the total transaction latency, includes application execution time, prepare time, and commit times.
-
Prepare Latency (microseconds) - prepare latency only.
-
Commit Latency (microseconds) - commit latency only.
The application execution time for a transaction can be calculated as:
execution time = total latency - prepare latency - commit latencyThe transactioncontention statistic shows
displays Java stacks for contested transactions. This statistic must be
enabled.
Warning
The collection of transaction contention statistics is very expensive computationally and should only be used in development or test systems
epadmin <network-address> display statistics --statistics=transactioncontention

3 occurrences on type session.RedundantStoreQT of stack:

  com.kabira.platform.KeyQuery._attachObject(Native Method)
  com.kabira.platform.KeyQuery.attachObject(KeyQuery.java:2192)
  com.kabira.platform.KeyQuery.getSingleResult(KeyQuery.java:121)
  com.streambase.sb.qt.dtm.runtime.DTMIndex.findObject(DTMIndex.java:179)
  com.streambase.sb.qt.dtm.runtime.DTMTable.findObject(DTMTable.java:452)
  com.streambase.sb.qt.dtm.runtime.DTMTable.getObject(DTMTable.java:493)
  com.streambase.sb.qt.dtm.runtime.DTMTable.getRowByPrimaryKeyImpl(DTMTable.java:525)
  com.streambase.sb.qt.runtime.RuntimeTableImpl.getRowByPrimaryKey(RuntimeTableImpl.java:608)
  com.streambase.sb.qt.runtime.ProxyRuntimeTable.getRowByPrimaryKey(ProxyRuntimeTable.java:293)
  com.streambase.cache.com.tibco.ep.sb.threegpp.component.sessionmanagement.extension.impl.DeleteWrapper_Implementation_26369D8A95F5D3161B7BEF7D7E03750B.op___Delete__0(DeleteWrapper_Implementation_26369D8A95F5D3161B7BEF7D7E03750B.java:240)
  com.streambase.cache.com.tibco.ep.sb.threegpp.component.sessionmanagement.extension.impl.DeleteWrapper_Implementation_26369D8A95F5D3161B7BEF7D7E03750B$Handler___Input_Stream_Handler_.enqueue(DeleteWrapper_Implementation_26369D8A95F5D3161B7BEF7D7E03750B.java:894)
  com.streambase.cache.com.tibco.ep.sb.threegpp.component.sessionmanagement.extension.impl.StorageModuleOperations_Implementation_A4DA0E51388BFB3594114FD5423E20EC_0.s_4521_op___By_Action__0(StorageModuleOperations_Implementation_A4DA0E51388BFB3594114FD5423E20EC_0.java:544)
  com.streambase.cache.com.tibco.ep.sb.threegpp.component.sessionmanagement.extension.impl.StorageModuleOperations_Implementation_A4DA0E51388BFB3594114FD5423E20EC.op___By_Action__0(StorageModuleOperations_Implementation_A4DA0E51388BFB3594114FD5423E20EC.java:388)
  com.streambase.cache.com.tibco.ep.sb.threegpp.component.sessionmanagement.extension.impl.StorageModuleOperations_Implementation_A4DA0E51388BFB3594114FD5423E20EC$Handler___By_Action_Input_Stream1_Handler_.enqueue(StorageModuleOperations_Implementation_A4DA0E51388BFB3594114FD5423E20EC.java:768)
  com.streambase.sb.runtime.modules.queues.SequencedStreamTarget.sendIntoDelegate(SequencedStreamTarget.java:139)
  com.streambase.sb.runtime.modules.queues.StreamTargetDataHolder.enqueue(StreamTargetDataHolder.java:122)
  com.streambase.sb.runtime.modules.queues.RingBufferHolder.enqueueElement(RingBufferHolder.java:155)
  com.streambase.sb.runtime.modules.queues.StreamTargetSequencer$RingBufferThread$RingBufferThreadTransaction.executeTaskImpl(StreamTargetSequencer.java:998)
  com.streambase.sb.client.internal.AbstractTransaction.run(AbstractTransaction.java:176)
  com.kabira.platform.Transaction.execute(Transaction.java:494)
  com.kabira.platform.Transaction.execute(Transaction.java:572)
  com.streambase.sb.client.internal.AbstractTransaction.start(AbstractTransaction.java:273)
  com.streambase.sb.client.internal.AbstractTransaction.executeTask(AbstractTransaction.java:232)
  com.streambase.sb.runtime.modules.queues.StreamTargetSequencer$RingBufferThread$RingBufferThreadTransaction.executeWithDetails(StreamTargetSequencer.java:984)
  com.streambase.sb.runtime.modules.queues.StreamTargetSequencer$RingBufferThread.run(StreamTargetSequencer.java:916)

2 occurrences on type session.RedundantStoreQT of stack:

  com.kabira.platform.KeyQuery._attachObject(Native Method)
  com.kabira.platform.KeyQuery.attachObject(KeyQuery.java:2192)
  com.kabira.platform.KeyQuery.getSingleResult(KeyQuery.java:121)
  com.streambase.sb.qt.dtm.runtime.DTMIndex.findObject(DTMIndex.java:179)
  com.streambase.sb.qt.dtm.runtime.DTMTable.findObject(DTMTable.java:452)
  com.streambase.sb.qt.dtm.runtime.DTMTable.getObject(DTMTable.java:493)
  com.streambase.sb.qt.dtm.runtime.DTMTable.getRowByPrimaryKeyImpl(DTMTable.java:525)
  com.streambase.sb.qt.runtime.RuntimeTableImpl.getRowByPrimaryKey(RuntimeTableImpl.java:608)
  com.streambase.sb.qt.runtime.ProxyRuntimeTable.getRowByPrimaryKey(ProxyRuntimeTable.java:293)
  com.streambase.cache.com.tibco.ep.sb.threegpp.component.sessionmanagement.extension.impl.WritelockWrapper_Implementation_A7BB71634A12F718FE154B42CF9A5ED6.op___Update_Writelock__0(WritelockWrapper_Implementation_A7BB71634A12F718FE154B42CF9A5ED6.java:200)
  com.streambase.cache.com.tibco.ep.sb.threegpp.component.sessionmanagement.extension.impl.WritelockWrapper_Implementation_A7BB71634A12F718FE154B42CF9A5ED6$Handler___Input_Stream_Handler_.enqueue(WritelockWrapper_Implementation_A7BB71634A12F718FE154B42CF9A5ED6.java:285)
  com.streambase.cache.com.tibco.ep.sb.threegpp.component.sessionmanagement.extension.impl.StorageModuleOperations_Implementation_A4DA0E51388BFB3594114FD5423E20EC_0.s_4521_op___By_Action__0(StorageModuleOperations_Implementation_A4DA0E51388BFB3594114FD5423E20EC_0.java:760)
  com.streambase.cache.com.tibco.ep.sb.threegpp.component.sessionmanagement.extension.impl.StorageModuleOperations_Implementation_A4DA0E51388BFB3594114FD5423E20EC.op___By_Action__0(StorageModuleOperations_Implementation_A4DA0E51388BFB3594114FD5423E20EC.java:388)
  com.streambase.cache.com.tibco.ep.sb.threegpp.component.sessionmanagement.extension.impl.StorageModuleOperations_Implementation_A4DA0E51388BFB3594114FD5423E20EC$Handler___By_Action_Input_Stream1_Handler_.enqueue(StorageModuleOperations_Implementation_A4DA0E51388BFB3594114FD5423E20EC.java:768)
  com.streambase.sb.runtime.modules.queues.SequencedStreamTarget.sendIntoDelegate(SequencedStreamTarget.java:139)
  com.streambase.sb.runtime.modules.queues.StreamTargetDataHolder.enqueue(StreamTargetDataHolder.java:122)
  com.streambase.sb.runtime.modules.queues.RingBufferHolder.enqueueElement(RingBufferHolder.java:155)
  com.streambase.sb.runtime.modules.queues.StreamTargetSequencer$RingBufferThread$RingBufferThreadTransaction.executeTaskImpl(StreamTargetSequencer.java:998)
  com.streambase.sb.client.internal.AbstractTransaction.run(AbstractTransaction.java:176)
  com.kabira.platform.Transaction.execute(Transaction.java:494)
  com.kabira.platform.Transaction.execute(Transaction.java:572)
  com.streambase.sb.client.internal.AbstractTransaction.start(AbstractTransaction.java:273)
  com.streambase.sb.client.internal.AbstractTransaction.executeTask(AbstractTransaction.java:232)
  com.streambase.sb.runtime.modules.queues.StreamTargetSequencer$RingBufferThread$RingBufferThreadTransaction.executeWithDetails(StreamTargetSequencer.java:984)
  com.streambase.sb.runtime.modules.queues.StreamTargetSequencer$RingBufferThread.run(StreamTargetSequencer.java:916)
A stack is displayed for each execution path that resulted in a contested transaction lock. See Analyzing Transaction Lock Contention for details on analyzing this data.
The transaction statistic shows transaction
locking statistics. The collection of transaction locking statistics
imposes a slight performance penalty and are not enabled by
default.
                   Locks               Deadlocks          Acquire Time (usecs)
    Read   Write Promote  Cntion  Normal Promote Destroyed     Avg     Min     Max Type Name
       4      16       0       1       5       0      7618 341409.1     0.2 1001227.8 session.RedundantStoreQT
       0       2       0       0       2       0         0 1189821.9 1147616.1 1232027.6 session.RedundantRelationQT
       0      14       0       0       0       0         0     0.4     0.1     0.9 com.tibco.ep.dtm.metrics.dtm.MetricNameDirectedTargetParameter
       0      14       0       0       0       0         0     0.3     0.0     2.1 com.tibco.ep.dtm.metrics.dtm.MetricsReportData
      14       0       0       0       0       0         0     0.3     0.2     0.4 com.tibco.ep.dtm.metrics.dtm.MetricDirectedTarget
       8       0       0       0       0       0         0     0.5     0.3     0.7 com.tibco.ep.security.dtm.admin.DTMAdminAuthenticator
       0      14       0       0       0       0         0     0.1     0.0     0.1 com.tibco.ep.dtm.metrics.dtm.MetricDirectedTargetReturn
       0       2       0       0       0       0         0     0.2     0.2     0.3 com.tibco.ep.security.dtm.admin.CurrentAuthenticatedPrincipal
       0       2       0       0       0       0         0     0.1     0.0     0.1 com.tibco.ep.security.dtm.admin.DTMAdminAuthenticator$AuthenticatedPrincipalMaintainer

....-
Locks - Read - number of read locks.
-
Locks - Write - number of write locks.
-
Locks - Promote - number of read locks promoted to a write lock.
-
Locks - Cntion - number of contested write locks.
-
Deadlocks - Normal - normal transaction deadlock.
-
Deadlocks - Promote - number of transaction deadlocks caused by lock promotions.
-
Deadlocks - Destroyed - number of transaction deadlocks caused by a lock attempt on an object being destroyed.
-
Acquire Time (usecs) - Avg - average lock acquisition time in microseconds.
-
Acquire Time (usecs) - Min - minimum lock acquisition time in microseconds.
-
Acquire Time (usecs) - Max - maximum lock acquisition time in microseconds.
-
Type Name - type name.
Some statistics collection turns on extra code or storage paths in the runtime. For each of these, an effort was made in the runtime to minimize the costs, but those costs are not zero. Application performance measurement is the best way to characterize these effects.
For a few of the statistics (such as --statistics=eventbus --detailed=true), there is also unbounded memory consumption.
If you leave the statistic enabled, you risk the node running out of memory.
Generally, statistics reporting can be more expensive (both computationally and in terms of contention) than statistics collection. There reasons for this are:
-
Most statistics are stored as a set of integer values that are relatively inexpensive to update. But nearly all reporting involves row by row string formatting of the statistic data, often including type lookups.
-
The synchronization for the collection of some statistics (particularly those in performance-sensitive paths) is parallelized to allow concurrent writers. Where possible, this is done using atomic memory counter primitives, otherwise using pools of mutexes, or in some cases a single mutex. For the runtime execution path, locking is minimized. But for the statistics clear path, in paths where the statistic is protected by mutexes, one or all of the mutexes get locked. The data collection with the worst impact on the system would be the allocator report with the detailed=true option. This data reporting can cause expensive contention in the shared memory allocator.
-
The returning of report data through the administration plug-in service uses the same runtime support that an application does; that is creating objects, consuming shared memory, and so on. A large report (generally those that use the detailed=true option) can temporarily consume a great deal of shared memory.
Run statistics reporting judiciously in a production system. Do not design an operator console where a room full of operators are all continuously issuing statistics commands.
Unless there is a good reason, avoid the detailed=true reporting.
Measure. Using your existing application performance testing, measure the impact of collecting the desired statistics. Also measure the impact of reporting the desired statistics.