Contents
EventFlow and LiveView fragment engines are JVMs instrumented with JMX-compliant Managed Beans that provide access to status information and provide a limited set of control methods analogous to certain epadmin commands. This allows EventFlow fragment engines to be visible to JMX-compliant network management tools such as Java JConsole or HP Openview.
The JConsole utility is provided as part of the JDK bundled with StreamBase. We are using JConsole on this page only as a freely available example of a JMX-compliant network management tool, not as the recommended tool to use. Your site's administrators may already use a commercial network management suite. If it is JMX-compliant, then all running EventFlow JVM engines should appear in that tool's list of running applications.
If your site uses an SNMP-based management tool, consider adopting one of the several available JMX to SNMP bridge packages, both commercial and open source.
The general steps are:
-
Select an EventFlow or LiveView engine name running locally, or connect to a remote engine on another host.
-
Use the Overview through VM Summary tabs to view information about the selected engine, or use the MBeans tab to view information and run commands provided by both StreamBase Server and by the StreamBase Runtime, seen as
com.kabira.platform.management.
The designation [ in syntax examples is a reminder that this command requires either the global parameter sn|ad]‑‑servicename or the ‑‑adminport and ‑‑hostname combination to identify the node or cluster of interest.
Start JConsole by typing jconsole in a StreamBase Command Prompt or type jconsole & in a macOS or Linux Terminal window on the same machine running your EventFlow fragments. JConsole starts with a dialog that
prompts you to select one of the running Java processes on the local machine.
Running Java processes are generally listed by their primary class names. Locate EventFlow engines in the Local Process list by their EventFlow engine name. There are three cases, each illustrated in the image below:
-
Fragments launched by Studio generally have a Studio-assigned engine name based on the fully qualified name of the Studio project, such as
com_tibco_sb_sample_bollingerband_BollingerB...in this image. -
You can assign a custom engine name as described below, such as
JvmEngineMin this image. -
Applications launched from the command line with epadmin generally have a generated engine name, such as
default-engine-for-com.tibco.sb.sample.loop.
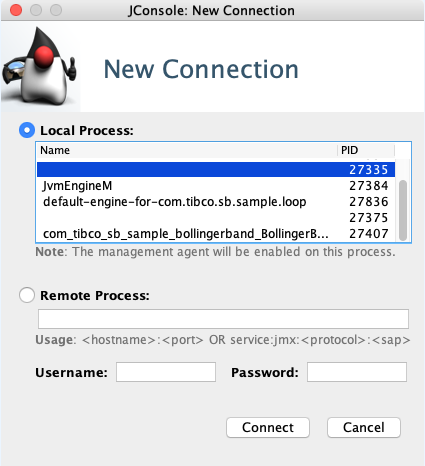 |
Each EventFlow or LiveView fragment runs with an unnamed companion JVM engine that handles node management tasks, which is shown with an empty name but active process ID. Unnamed JVMs are not instrumented for JMX compliance.
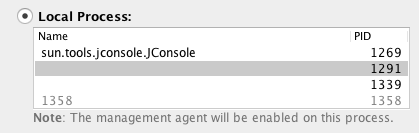
Remember that when you stop a fragment in Studio, it leaves the node installed and started. Such nodes appear in the JConsole Local Process list as a grayed-out entry showing only its process ID:
 |
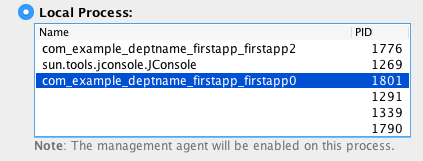
When Studio runs multiple instances of the same fragment, it gives each fragment a unique JVM engine name by appending an integer:
 |
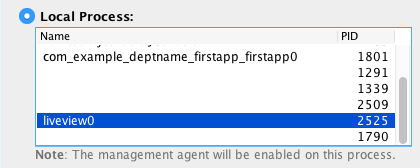
Studio assigns LiveView fragments a simple engine name instead of a project's fully qualified name:
 |
To assign a specific engine name:
-
In Studio, edit a run configuration. Engine names are assigned in the Parameters tab.
-
To run a fragment launched with the epadmin command, assign an engine name in a configuration file of type com.tibco.ep.dtm.configuration.node.
JConsole presumes that current JVM processes are configured to run with SSL/TSL security. If your EventFlow or LiveView engine is not yet configured with security, JConsole shows an error dialog:
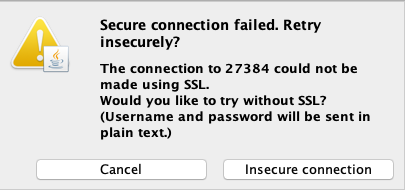 |
For engines under your control, it is safe to proceed with an insecure connection.
To connect to an EventFlow or LiveView engine running on another machine, you need the following information:
-
The hostname or IP address hosting the engine.
-
A user name and password configured to log in with administrator access on that engine.
-
The JMX port for the engine of interest OR the complete JMX service address for that engine.
You need the user name and password independent of the engine's SSL/TLS status. The JMX system does not participate in the StreamBase Runtime's Trusted Hosts system, so you must have an administrator login with password ready to use.
Note
EventFlow and LiveView fragments running under the default security configuration use the OS user name that installed and started the node. However, the default configuration sets up an unknown and unknowable password. To enable remote access to a fragment, you must configure a password for the default user name on the local node's machine, or add a new user with administrator rights. For example, on node A's machine, run:
epadmin [sn|ad] change password --username=sbuser --password=simpleTest this name and password on the local node:
epadmin [sn|ad] --username=sbuser --password=simple display engineTo determine a node's JMX port or JMX Service Address, use epadmin display engine on the node of interest, or retrieve the same information from Studio's Clusters view. First, retrieve the remote node's administration port for the node of interest:
epadmin display services servicetype=node
Then use a command like the following to retrieve the JMX port of the remote node. You can use an IP address for the hostname parameter. The specified hostname must be reachable with ping from your current machine.
epadmin[--hostname=sn|ad]hostnamedisplay engine
If the remote node is configured to require passwords, then:
epadmin[--host=sn|ad]hostname--username=sbuser --password=simple display engine
Look for information lines like the following:
JMX State = Started
JMX Service Address = Balta.local:8875
JMX Service URL = service:jmx:rmi:///jndi/rmi://Balta.local:8875/jmxrmi
Once you have the JMX port of the remote node, use that port with the machine's pingable URI.
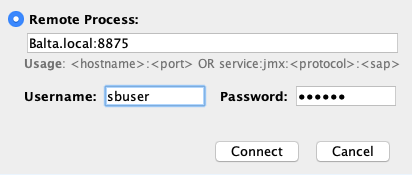 |
You can also use the full JMX service address:
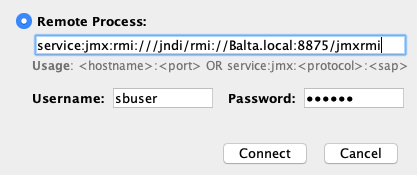 |
As with local connections, JConsole presumes that the remote fragment is configured to run with SSL/TSL security. If your remote EventFlow or LiveView engine is not yet configured with security, JConsole shows an error dialog:
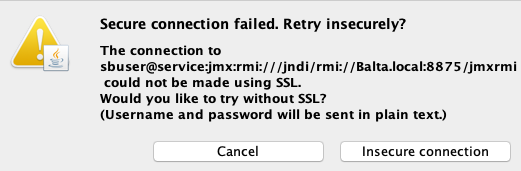 |
For engines under your control, it is safe to proceed with an insecure connection.
Once connected to an EventFlow or LiveView fragment's JVM engine, use the tabs in the JConsole window to view status information. The following tabs may be of special interest to EventFlow and LiveView users:
- Memory
-
Use the Memory tab to see a real time analysis of the memory usage and garbage collection activity of the JVM that is hosting the fragment.
- VM Summary
-
The VM Summary tab shows the VM arguments with which the server started and its classpath, among other statistics. Use this information to troubleshoot startup issues.
Use the MBeans tab to view status information and to send administration commands as allowed by the engine's Managed Beans. In JConsole, the relevant portion of the MBeans tab for EventFlow fragments is like the following example:
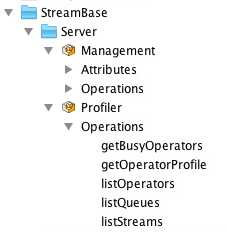 |
Click each Attribute node in turn and click to see current status for the specified area.
Not all Operations commands are active. If an Operation page has an active button, then the server's MBean supports that operation.
For example, click the suspend command, type a container name in your running application, such as default, and click the button. To resume that container, use analogous steps in the resume node.
The Operations commands allow the equivalent of epadmin commands for EventFlow engines.
The following Operations commands in the Server Management bean have active buttons: shutdown, resume, suspend, leadership, killConnection, getDynamicVariable, and statusOperator.
All Operations in the Server Profiler bean have active buttons.
The MBeans tab for a LiveView fragment might show a separate entry for a companion EventFlow engine that runs alongside the LiveView engine. For example:
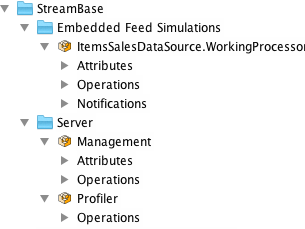 |
Use the MBeans tab to view status information and to send administration commands as allowed by the StreamBase Runtime's Managed Beans. Look for the section com.kabira.platform.management, like the following example:
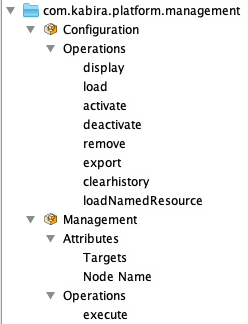 |
The Runtime exposes MBeans for Configuration and Management. With Management > Operations, you can run the equivalent of epadmin commands.
The following image shows an example of running display history.
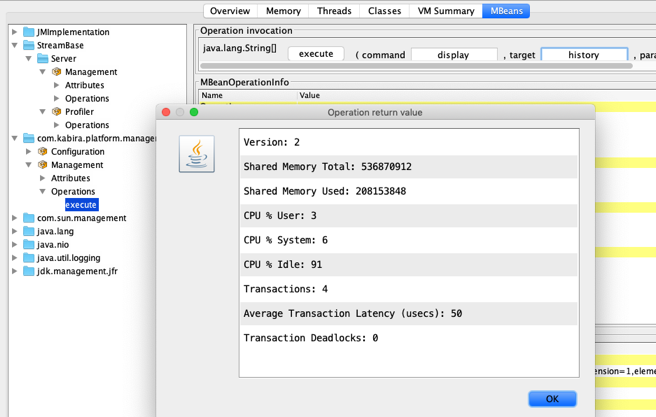 |
The Runtime exposes MBeans for Configuration and Management. With Management > Operations > execute, you can run the equivalent of epadmin commands.