Contents
Query the Get / metrics REST endpoint to view built-in as well as user-defined metrics.
-
From the REST API, enter a metric name prefix to filter the query by name:
-
Enter
builtinto limit the query to the as-provided metrics for the engine and node. Enteringbuiltin.enginefurther filters by engine-provided metric names. -
Enter the prefix for a user-defined metric to filter by that metric name.
-
Omit the prefix and metric type to display all metric names (built-in and user-defined).
-
Enter a metric type to further refine your query.
-
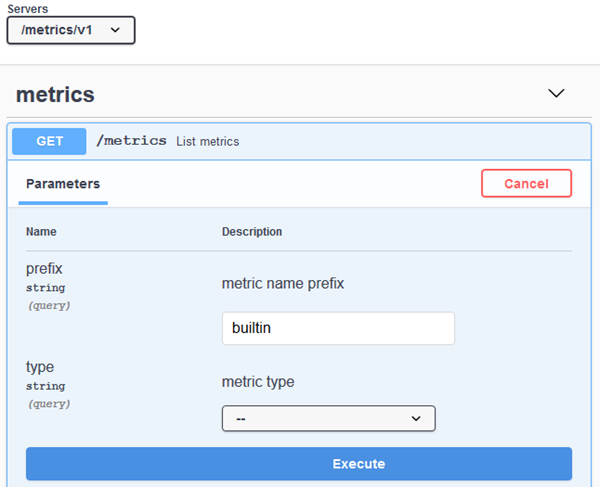 |
After you click , the Response body presents the name, type and description for each metric. The following example shows the available metrics for an EventFlow fragment — specifically, based on the Best Bids and Asks sample. Long lines below wrap to the next, for clarity.
{
  "builtin.engine.com_tibco_sb_sample_bestbidsandasks_BestBidsAsks1.queue.default:ParallelSequence.
   depth.second": {
    "name": "builtin.engine.com_tibco_sb_sample_bestbidsandasks_BestBidsAsks1.queue.default:
    ParallelSequence.depth.second",
    "type": "METER",
    "description": "Queue default:ParallelSequence depth per second for engine com_tibco_sb_sample_
    bestbidsandasks_BestBidsAsks1",
    "lastUpdatedTimeStamp": 1578432682,
    "metric": {
      "count": 0,
      "fiveMinuteRate": 0,
      "oneMinuteRate": 0,
      "meanRate": 0,
      "fifteenMinuteRate": 0
    }
  },
  "builtin.cpu.system.utilization.percentage": {
    "name": "builtin.cpu.system.utilization.percentage",
    "type": "HISTOGRAM",
    "description": "Percent system CPU utilization for machine hosting node nodename.cluster",
    "lastUpdatedTimeStamp": 1578432681,
    "metric": {
      "count": 18437,
      "snapshot": {
        "values": [
          1,
          1,
          1,
          1,
          1,
...
Query the Get / metrics / {name} REST endpoint to search by the full metric name. For example, use a full metric name as shown
in the Get metrics query results above, such as builtin.cpu.system.utilization.percentage. The full name can include the as-provided metric names or user-defined ones.
The following are the supported built-in metrics:
Total transactions over last second
Metrics type: Meter
builtin.node.transactions.total.rate
eg: builtin.node.transactions.total.rate 1000

Tuples per engine over last second
Metrics type: Meter
builtin.engine.[partially_qualified_engine_name].tuples.rate
eg1: builtin.engine.admin.tuples.rate 1000
eg2: builtin.engine.engine1.tuples.rate 4000

Average transaction latency over last second
Metrics type: Meter
builtin.node.transactions.latency.average.microseconds
eg: builtin.node.transactions.latency.average.microseconds 0.5

Total transaction deadlocks over last second
Metrics type: Meter
builtin.node.transactions.deadlocks.rate
eg: builtin.node.transaction.deadlocks.rate 10

Current user, system and idle CPU utilization
Metrics type: Histogram
builtin.cpu.[user/system/idle].utilization.percentage
eg1: builtin.cpu.user.utilization.percentage 20%
eg2: builtin.cpu.system.utilization.percentage 30%
eg3: builtin.cpu.idle.utilization.percentage 50%

Current shared memory utilization
Metrics type: Histogram
builtin.node.shared.memory.kilobytes
eg: builtin.node.shared.memory.utilization.kilobytes 1000000
Metrics type: Histogram
builtin.node.shared.memory.percentage
eg: builtin.node.shared.memory.utilization.percentage 30%

Current heap memory utilization per engine
Metrics type: Histogram
builtin.engine.[partially_qualified_engine_name].heap.memory.utilization.bytes
eg1: builtin.engine.admin.heap.memory.utilization.bytes 1000000
eg2: builtin.engine.engine1.heap.memory.utilization.bytes 1000000
Metrics type: Histogram
builtin.engine.[partially_qualified_engine_name].heap.memory.utilization.percentage
eg3: builtin.engine.admin.heap.memory.utilization.percentage 40%
eg4: builtin.engine.engine1.heap.memory.utilization.percentage 50%

Parallel region queue depth per engine over last second
Metrics type: Meter
builtin.engine.<partially_qualified_engine_name*>.queue.<fully_scoped _queue_path>.depth.second
eg1: builtin.engine.admin.queue.default.in1.second 3
eg2: builtin.engine.engine1.queue.default.in2.second 5

Notes: partially_qualified_engine_name is the short engine name without the node name
          and cluster name
Query the Get / metrics REST endpoint to view built-in and LiveView-specific metrics.
-
From the REST API, enter a metric name prefix to filter the query by name:
-
Enter
liveview(case-sensitive) to limit the query to the as-provided LiveView-specifc metrics for the engine and node. -
Alternatively,
builtinto limit the query to the as-provided metrics for the engine and node. -
Omit the prefix and metric type to display all metric names (built-in and LiveView-specific).
-
Enter a granular query based on the format
[liveview.dlorsl.engineName.tablename].For example:
liveview.dl.liveview0.ItemSales
-
LiveView publishes two sets of metrics: a set of metrics with properties and a legacy set of dot-delimited metrics.
LiveView metrics with properties:
| Metric Name | Description |
| liveview_num_rows | Number of rows in the table |
| liveview_inbound_tuples_per_second | Inbound tuples per second |
| liveview_memory_used_mb | Memory used (MB) |
| liveview_num_queued_tuples | Number of queued tuples |
| liveview_num_published_tuples | Number of published tuples |
| liveview_num_sessions | Number of active sessions |
| liveview_num_session_queries | Number of session queries |
The metrics have properties according to the below table:
| Property Name | Description | Metrics with this property |
| node | Node name | All LiveView metrics |
| engine | Engine name | All LiveView metrics |
| service_type | "sl" if services only, "dl" otherwise | All LiveView metrics |
| user_type | Internal or end user, depending on whether the user is an LV internal user | liveview_num_sessions, liveview_num_session_queries |
| table_name | Table name | All LiveView metrics except liveview_num_sessions |
| table_group | Table group: (system, user, CEP, dynamic) | All LiveView metrics except liveview_num_sessions |
Finding the number of rows in a table named ItemsSales:
$ epadmin --servicename nodename.cluster read metric \
        --name liveview_num_rows --properties table_name=ItemsSales
[nodename.cluster] Last Reset = 2021-12-16 14:37:56.265-0500
[nodename.cluster] Last Updated = 2021-12-16 14:45:12.003-0500
[nodename.cluster] Count = 271
Finding the total number of published tuples across all user tables:
$ epadmin --servicename nodename.cluster read metric \
        --name liveview_num_published_tuples --properties table_group=user
[nodename.cluster] Last Reset = 2021-12-16 14:37:56.267-0500
[nodename.cluster] Last Updated = 2021-12-16 14:48:30.005-0500
[nodename.cluster] Count = 1194
The legacy LiveView metrics format is shown in the example below:
"liveview.dl.liveview0.ItemsSales.number.session.queries.total": {
    "name": "liveview.dl.liveview0.ItemsSales.number.session.queries.total",
    "type": "COUNTER",
    "description": "Total number of session queries for table ItemsSales.",
    "lastUpdatedTimeStamp": 1585016617,
    "metric": {
      "count": 3
    }
  },
Where liveview is the prefix, dl represents the LiveView data layer (or sl for the LiveView service layer), liveview0 represents the LiveView engine running on this particular node, following by the
table name and metric.
The first five legacy LiveView metrics displayed are table-specific, and are displayed for every data table in your LiveView fragment. Additionally, these same five metrics are also displayed for the LVAlerts and LiveViewStatistics system tables. Thus at minimum, the web service query produces 10 "table" metrics (5 metrics x 2 system tables). If you add or drop a table from your running LiveView fragment, the corresponding metrics are updated as well. Note that this applies to the DL (LiveView data layer) case. The services layer does not support dynamic tables, therefore contain no table metrics.
In addition to the five table-specific metrics, the query also generates four LiveView engine metrics and three LiveView filtered metrics
The following are the legacy LiveView metrics:
TotalQueuedTuples per table
Metric type: Counter
liveview.[SLorDL].[engineName].[tableName].queued.tuples.total

InboundTuplesPerSec per table
Metric type: Counter
liveview.[SLorDL].[engineName].[tableName].inbound.tuples.seconds

Total number of rows per table
Metric type: Counter
liveview.[SLorDL].[engineName].[tableName].number.rows.total

Total memory used per table
Metric type: Counter
liveview.[SLorDL].[engineName].[tableName].memory.total.megabytes

Total number of session queries per table
Metric type: Counter
liveview.[SLorDL].[engineName].[tableName].number.session.queries.total

Total number of sessions
Metric type: Counter
liveview.[SLorDL].[engineName].number.sessions.total

Total number of session queries across all tables
Metric type: Counter
liveview.[SLorDL].[engineName].alltables.number.session.queries.total

Total memory (in MB) used by all tables.
Metric type: Counter
liveview.[SLorDL].[engineName].alltables.memory.total.megabytes

Total queued tuples across all tables.
Metric type: Counter
liveview.[SLorDL].[engineName].alltables.queued.tuples.total
Examples:
epadmin servicename=nodename.cluster display metricQuerying all tables as an aggregate: example
Run a query such as liveview.dl.liveview0.alltables.
{
  "liveview.dl.liveview0.alltables.number.session.queries.total": {
    "name": "liveview.dl.liveview0.alltables.number.session.queries.total",
    "type": "COUNTER",
    "description": "Total number of session queries across all tables.",
    "lastUpdatedTimeStamp": 1585674681,
    "metric": {
      "count": 4
    }
  },
  "liveview.dl.liveview0.alltables.queued.tuples.total": {
    "name": "liveview.dl.liveview0.alltables.queued.tuples.total",
    "type": "COUNTER",
    "description": "Total queued tuples across all tables.",
    "lastUpdatedTimeStamp": 1585674702,
    "metric": {
      "count": 0
    }
  },
  "liveview.dl.liveview0.alltables.memory.total.megabytes": {
    "name": "liveview.dl.liveview0.alltables.memory.total.megabytes",
    "type": "COUNTER",
    "description": "Total memory (in MB) used by all tables.",
    "lastUpdatedTimeStamp": 1585674702,
    "metric": {
      "count": 6
    }
  }
}Use epadmin commands to display, read, or reset metrics details using the following command syntax.
display metric [--name=<String>]
  [--type=<[meter, counter, histogram, timer, gauge, all]>]

  Display a list of registered Metrics

  [--name=<String>] name of the Metric to display. Match with 'string
     contains'. Default: none
  [--type=<[meter, counter, histogram, timer, gauge, all]>] type of metrics
     to search. One of { meter, counter, histogram, timer, gauge, all }.
     (default: all). Default: all

read metric --name=<String>

  Read a specific metric

  --name=<String> The name of the metric to read.

reset metric --name=<String>

  Reset a specific metric

  --name=<String> The name of the metric to reset.
To reset and then read the metrics, run commands like the following:
epadmin servicename=nodename.cluster reset metric name=builtin.node.transactions.total.rate

epadmin servicename=nodename.cluster read metric name=builtin.node.transactions.total.rate
Notice the metrics are reset when you query the web service again:
[nodename.cluster] Last Reset = 2020-01-14T19:19:32.249054100Z
[nodename.cluster] Last Updated = 2020-01-14T19:20:13.021432200Z
[nodename.cluster] Count = 431
[nodename.cluster] Mean One Minute Rate = 10.2
[nodename.cluster] One Minute Rate = 11.81
[nodename.cluster] Five Minute Rate = 12.85
[nodename.cluster] Fifteen Minute Rate = 13.08
Running a command like the following shows the built-in metrics that are available at the node and engine level (a running Best Bids and Asks sample is shown below). Note that user-built metrics via the Java Client API would also be displayed if they were compiled before the node started (not shown):
epadmin servicename=nodename.cluster display metric[nodename.cluster] Name = builtin.cpu.idle.utilization.percentage
[nodename.cluster] Type = HISTOGRAM
[nodename.cluster] Description = Percent idle CPU utilization for machine hosting node nodename.cluster
[nodename.cluster] Name = builtin.cpu.system.utilization.percentage
[nodename.cluster] Type = HISTOGRAM
[nodename.cluster] Description = Percent system CPU utilization for machine hosting node nodename.cluster
[nodename.cluster] Name = builtin.cpu.user.utilization.percentage
[nodename.cluster] Type = HISTOGRAM
[nodename.cluster] Description = Percent user CPU utilization for machine hosting node nodename.cluster
[nodename.cluster] Name = builtin.engine.com_tibco_sb_sample_bestbidsandasks_BestBidsAsks0.heap.memory.
utilization.bytes
[nodename.cluster] Type = HISTOGRAM
[nodename.cluster] Description = Heap memory used (bytes) for engine com_tibco_sb_sample_bestbidsandasks_
BestBidsAsks0
[nodename.cluster] Name = builtin.engine.com_tibco_sb_sample_bestbidsandasks_BestBidsAsks0.heap.memory.
utilization.percentage
[nodename.cluster] Type = HISTOGRAM
[nodename.cluster] Description = Percent heap memory used for engine com_tibco_sb_sample_bestbidsandasks_
BestBidsAsks0
[nodename.cluster] Name = builtin.engine.com_tibco_sb_sample_bestbidsandasks_BestBidsAsks0.queue.default:
ParallelSequence.depth.second
[nodename.cluster] Type = METER
[nodename.cluster] Description = Queue default:ParallelSequence depth per second for engine com_tibco_sb_
sample_bestbidsandasks_BestBidsAsks0
[nodename.cluster] Name = builtin.engine.com_tibco_sb_sample_bestbidsandasks_BestBidsAsks0.tuples.rate
[nodename.cluster] Type = METER
[nodename.cluster] Description = Tuple rate for engine com_tibco_sb_sample_bestbidsandasks_BestBidsAsks0
[nodename.cluster] Name = builtin.node.shared.memory.kilobytes
[nodename.cluster] Type = HISTOGRAM
[nodename.cluster] Description = Shared memory used (kilobytes) for node nodename.cluster
[nodename.cluster] Name = builtin.node.shared.memory.percentage
[nodename.cluster] Type = HISTOGRAM
[nodename.cluster] Description = Percent shared memory used for node nodename.cluster
[nodename.cluster] Name = builtin.node.transactions.deadlocks.rate
[nodename.cluster] Type = METER
[nodename.cluster] Description = Transaction deadlock rate for node nodename.cluster
[nodename.cluster] Name = builtin.node.transactions.latency.average.microseconds
[nodename.cluster] Type = METER
[nodename.cluster] Description = Average transaction latency (microseconds) for node nodename.cluster
[nodename.cluster] Name = builtin.node.transactions.total.rate
[nodename.cluster] Type = METER
[nodename.cluster] Description = Transaction rate for node nodename.clusterRunning a command like the following shows the built-in and LiveView-specific metrics. Note that user-built metrics via the Java Client API would also be displayed if they were compiled before the node started (not shown).
epadmin servicename=nodename.cluster display metricAn abbreviated list of metrics, based on running the Hello LiveView sample in a node called LVnode, follows:
[LVnode.SBuser] Type = COUNTER
[LVnode.SBuser] Description = Total number of inbound tuples per second for table LiveViewStatistics.

[LVnode.SBuser] Name = liveview.dl.liveview0.LiveViewStatistics.memory.total.megabytes
[LVnode.SBuser] Type = COUNTER
[LVnode.SBuser] Description = Total memory (in MB) used by table LiveViewStatistics.

[LVnode.SBuser] Name = liveview.dl.liveview0.LiveViewStatistics.number.rows.total
[LVnode.SBuser] Type = COUNTER
[LVnode.SBuser] Description = Total number of rows in table LiveViewStatistics.

[LVnode.SBuser] Name = liveview.dl.liveview0.LiveViewStatistics.number.session.queries.total
[LVnode.SBuser] Type = COUNTER
[LVnode.SBuser] Description = Total number of session queries for table LiveViewStatistics.

[LVnode.SBuser] Name = liveview.dl.liveview0.LiveViewStatistics.queued.tuples.total
[LVnode.SBuser] Type = COUNTER
[LVnode.SBuser] Description = Total queued tuples for table LiveViewStatistics

[LVnode.SBuser] Name = liveview.dl.liveview0.alltables.memory.total.megabytes
[LVnode.SBuser] Type = COUNTER
[LVnode.SBuser] Description = Total memory (in MB) used by all tables.

[LVnode.SBuser] Name = liveview.dl.liveview0.alltables.number.session.queries.total
[LVnode.SBuser] Type = COUNTER
[LVnode.SBuser] Description = Total number of session queries across all tables.

[LVnode.SBuser] Name = liveview.dl.liveview0.alltables.queued.tuples.total
[LVnode.SBuser] Type = COUNTER
[LVnode.SBuser] Description = Total queued tuples across all tables.

[LVnode.SBuser] Name = liveview.dl.liveview0.number.sessions.total
[LVnode.SBuser] Type = COUNTER
[LVnode.SBuser] Description = Total number of sessions.
...