Contents
You can create Java client programs that extend the com.streambase.sb.monitor API to obtain runtime statistics about a running EventFlow engine, such as performance data for your StreamBase application.
Using the com.streambase.sb.monitor API, you can get the same statistics that are available in display-only mode from one of the StreamBase monitoring utilities
described in Monitoring and Profiling.
The key difference is that, in your client, you can take some action based on the current performance numbers. This topic describes the classes and methods you can use to capture specific types of performance data.
Note
The results when using the StreamBase Monitor API in a custom program to gather statistics on operator use might not match the numbers shown using one of the StreamBase-provided profile views of the same server session. Each set of numbers is valid in its context.
Consider first an example monitoring client. The following shows a complete SimpleMonitor.java example that uses the com.streambase.sb.monitor API. Notice that this example assumes that StreamBase Server is started on port 10000.
import com.streambase.sb.*;
import com.streambase.sb.monitor.*;

class SimpleMonitor {
  public static void main(String[] argv) {

    class MyMonListener implements MonitorListener {
      public void snapshotReceived(Snapshot monSnap) {
              monSnap.prettyPrint(true,true,true,false);
      }
    }

    System.out.println("Start Simplest Monitor...");
    MyMonListener listener = new MyMonListener();
      try {
        final String sburl = "sb://localhost:10000";
        StreamBaseMonitor sbmon = new StreamBaseMonitor(sburl);
        sbmon.addMonitorListener(listener);
        sbmon.run();
        }
      catch (StreamBaseException e) {
        System.out.println("Exception in StreamBaseMonitor run: "+ e);
      }
      System.out.println("End Simplest Monitor...");
  }
}
Notes:
-
The import statements include
com.streambase.sb.monitor.* -
We create a
StreamBaseMonitorobject, and we create an object that is aMonitorListener. The StreamBase API calls your listener every time it receives a snapshot of performance data, set by a interval of 1000 milliseconds (one second). -
In the
prettyPrintmethod, the boolean parameters are:-
do_sys- whether to printSystemInfo -
do_op- whether to printOperatorInfos -
do_thr- whether to printThreadInfos -
do_tuples- whether to print individualStatTuples
-
-
The How the Monitor API Works explains how the API works with the server. More API details are available in its Javadoc.
-
See the Simple StreamBase Application section below for an illustration of a "pass.sbapp" that this client can use.
-
See the Compiling, Starting Server, and Running section for additional information about using the example client.
-
Note that the StreamBase Monitor API is not thread-safe. You cannot share a client connection across threads. For example, if you attempt to close a client from a thread other than the one in which it was created, a stack overflow error will occur. To run clients multi-threaded, you would need to establish a new client for each thread.
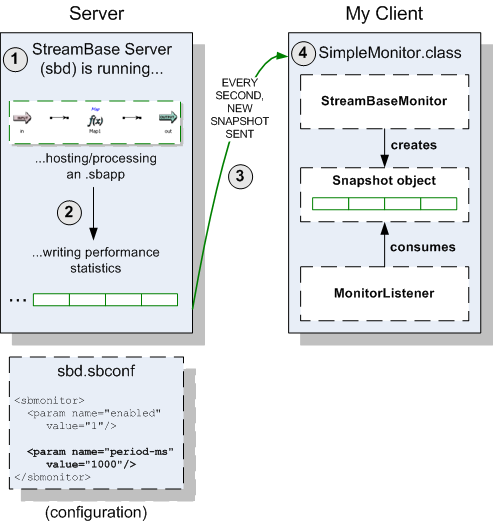
A running EventFlow engine produces monitoring information — everything you see with the StreamBase Monitor utility. A snapshot
is generated every cycle. The cycle's period is one second. The set of tuples is punctuated by a marker tuple (with "" for the type of data). Most of the numbers are absolute counts of entities, such as the count of tuples enqueued or dequeued
on an input queue.
The general idea is that a Snapshot object stores a snapshot of information from a StreamBase application. Snapshot objects are created by the StreamBaseMonitor class, and consumed by MonitorListeners. The conceptual view is illustrated here:
Note
The StreamBase Monitor API is not thread-safe. You cannot share a client connection across threads. For example, if you attempt to close a client from a thread other than the one in which it was created, a stack overflow error will occur. To run clients multi-threaded, you would need to establish a new client for each thread.
Now let's take a look at the classes and methods, and specifically how to get different types of performance data.
This class monitors a running StreamBase Server, and gathers statistics. It periodically sends Snapshot objects to all registered MonitorListeners.
The constructor takes the URL for connecting to an EventFlow engine, just as any StreamBase client does.
As shown in the previous code example, the Java client that you write should implement a MonitorListener interface. It is registered by the addMonitorListener method, and unregistered by the removeMonitorListener method. The listener will be called for every snapshot received from the EventFlow engine; it will be given a MonitorSnapshot object.
| Method | Description |
|---|---|
addMonitorListener(MonitorListener) |
Add a listener, which will be called for each snapshot. If the given listener has already been added, just return. Listeners are called in the order in which they were added. |
finalize() |
|
removeMonitorListener(MonitorListener) |
Remove a listener. |
removeMonitorListeners() |
Remove all listeners. |
run() |
Connect to a running EventFlow engine and read snapshots, calling the listener as they are received. |
terminate() |
Ask the monitor to terminate. Termination will occur after the next snapshot, or after the current snapshot if terminate() is invoked from within a MonitorListener's snapshotReceived() method.
|
To start processing, the Java client calls the run() method. This will loop, reading snapshots, until either the connection is terminated, the client is interrupted, or the terminate() method is called (either another thread or a listener can call it).
A MonitorListener is an interface that the client implements, providing the snapshotReceived method.
| Method | Description |
|---|---|
snapshotReceived(MonitorSnapshot) |
The method to process a MonitorSnapshot. |
The Snapshot object stores a snapshot of information from a StreamBase application. Snapshot objects are created by the StreamBaseMonitor class, and are consumed by MonitorListeners. New snapshots are produced at regular intervals, with the default every 1000 milliseconds (1 second).
The Snapshot object contains the entire snapshot, including incremental changes from the previous snapshot.
In your client, you can ask the Snapshot to return an object for the particular kind of information in which you are interested:
-
SystemInfo -
OperatorInfo -
ThreadInfo
The methods are, respectively:
-
getSystemInfo -
getOperatorInfo -
getThreadInfo
The call then asks these objects to return more detailed information.
Snapshot object's methods:
| Method | Description |
|---|---|
int getCycle() |
Return the cycle number of this snapshot. All subsequent snapshots will have an increasing cycle number. This is a monotonically increasing integer generated by the StreamBase Server. |
OperatorInfo getOperatorInfo(String name) |
Returns information about the specified operator. |
SystemInfo getSystemInfo() |
Return a SystemInfo object for this snapshot.
|
ThreadInfo getThreadInfo(String name) |
Returns information about the specified thread. |
Timestamp getTimestamp() |
Return the time when this snapshot was taken. |
Iterator operatorInfos() |
Returns an iterator over all the OperatorInfo objects.
|
Iterator operatorNames() |
Returns the set of all operator names. |
Iterator threadInfos() |
Returns an iterator over all the ThreadInfo objects.
|
Iterator threadNames() |
Returns the set of all thread names. |
void prettyPrint() |
Shortcut for prettyPrint(true, true, true, false). The boolean parameters are:
|
String toString() |
Returns a string representation of the Snapshot object.
|
void terminate() |
Ask the StreamBaseMonitor to terminate at the end of the current snapshot. |
Represents system-level information. Instances of this class should be retrieved from a Snapshot. On a SystemInfo object, the caller can invoke these methods:
| Method | Description |
|---|---|
long getFreeMemory() |
Returns the amount of free memory in the StreamBase Server process. |
long getMaxMemory() |
Returns the maximum amount of memory which the StreamBase Server process is allowed to allocate. |
int getTimeRunning() |
The amount of time StreamBase engine has been running, in seconds. |
int getTotalMemory() |
Returns the total amount of memory available for use in the StreamBase Server process. |
long getUsedMemory() |
Returns the total amount of memory currently in use in the StreamBase Server process. |
Represents information about a single operator in a StreamBase application. Instances of this class should be retrieved from
a Snapshot. On an OperatorInfo object, the caller can invoke these methods:
| Method | Description |
|---|---|
int getInputPortCount |
Returns the number of input ports on this operator. |
int getInputTuplesDequeuedDelta() |
Returns the number of input tuples consumed by this operator since the previous Snapshot.
|
int getInputTuplesDequeuedTotal() |
Returns the total number of input tuples consumed by this operator since the StreamBase Server was started. (Deprecated: use getTotalInputTuplesDequeued() instead.) |
int getInputTuplesEnqueuedDelta() |
Returns the number of tuples enqueued on this operator's input streams since the previous Snapshot.
|
int getInputTuplesEnqueuedTotal() |
Returns the total number of input tuples enqueued on this operator's input streams since the StreamBase Server was started. (Deprecated: use getTotalInputTuplesEnqueued() instead.) |
String getName() |
Returns the name of the operator. |
int getOutputPortCount() |
Returns the number of output ports on this operator. |
int getOutputTuplesEnqueuedDelta() |
Returns the number of output tuples produced by this operator since the previous Snapshot.
|
int getOutputTuplesEnqueuedTotal() |
Returns the total number of output tuples produced by this operator since the StreamBase Server was started. |
double getPercentUsage() |
The percentage usage is (profiler hits / total profiler hits.) |
int getProfilerHits() |
Number of miniticks used by the operator (incremental value, since the last stats snapshot), as determined by profiler samples. |
int getSize() |
Returns the size the operator. |
String getStatus() |
Returns the status of the operator. |
long getTotalInputTuplesDequeued() |
Returns the total number of input tuples consumed by this operator since the StreamBase Server was started. |
long getTotalInputTuplesEnqueued() |
Returns the total number of input tuples enqueued on this operator's input streams since the StreamBase Server was started. |
int getTotalProfilerHits() |
Number of miniticks used by all operators in the contained ProfileState (an incremental value, since the last stats snapshot).
|
void prettyPrint() |
Pretty-print an OperatorInfo object to the standard output. The boolean parameters are:
|
String toString() |
Returns a string representation of the OperatorInfo object.
|
About the Profiler. In the previous table, several methods mentioned the term profiler. If you use module references in your StreamBase application, each module keeps track of its own stats. That is, the number
of tuples sent and/or received on each port of each operator in the module. StreamBase performs profiling to track the CPU
usage. There is one ProfileState for each module that has been set to run in a parallel region. Every 10 milliseconds, a profiling thread notes which method
is currently being run. Then by default, every second, the stats thread obtains and reports the stats from each module.
Represents information about a single thread in a StreamBase Server. Instances of this class should be retrieved from a Snapshot. On a ThreadInfo object, the caller can invoke these methods:
| Method | Description |
|---|---|
Object clone() |
|
String getName() |
Return the name of the thread. |
double getPercentCPU() |
Returns the percent of CPU used by this thread. |
double getPercentSystem() |
Returns the percent of system CPU time used by this thread. |
double getPercentUser() |
Returns the percent of user CPU time used by this thread. |
int getSystemTimeDelta() |
Returns the system time spent by thread since the last Snapshot, in microseconds.
|
int getSystemTimeTotal() |
Returns the system time spent by this thread since the StreamBase Server started, in microseconds. |
int getUserTimeDelta() |
Returns the user time spent by thread since the last Snapshot, in microseconds.
|
int getUserTimeTotal() |
Returns the user time spent by thread since the StreamBase Server started, in microseconds. |
String toString() |
Returns a string representation of the ThreadInfo object.
|
The following example includes the use of the SystemInfo, OperatorInfo, and ThreadInfo objects to process the Monitor snapshot.
...
public static void main(String[] argv) {

class MyMonListener implements MonitorListener {
  public void snapshotReceived(Snapshot monSnap) {
    // process the monitor snapshot
    System.out.println("----> Snapshot: "+ monSnap.toString());
    SystemInfo sysInfo = monSnap.getSystemInfo();
    for (Iterator i=monSnap.operators(); i.hasNext(); ) {
      OperatorInfo opInfo = (OperatorInfo)i.next();
      System.out.println("  "+ opInfo.getName() + ": "+ opInfo.toString());
    }
    for (Iterator i=monSnap.threads(); i.hasNext(); ) {
      ThreadInfo thdInfo = (ThreadInfo)i.next();
      System.out.println("  "+ thdInfo.getName() + ": "+ thdInfo.toString());
    }
  }
}

System.out.println("Start Monitor...");
MyMonCB listener = new MyMonListener();
 try {
   StreamBaseMonitor sbmon = new StreamBaseMonitor("sb://mymachine:10000");
   sbmon.addMonitorListener(listener);
   sbmon.run();
  }
  catch (StreamBaseException e) {
    System.out.println("Exception StreamBaseMonitor run: "+ e);
  }
}Before you can use the client, of course you need a StreamBase application, such as the simple one illustrated here:
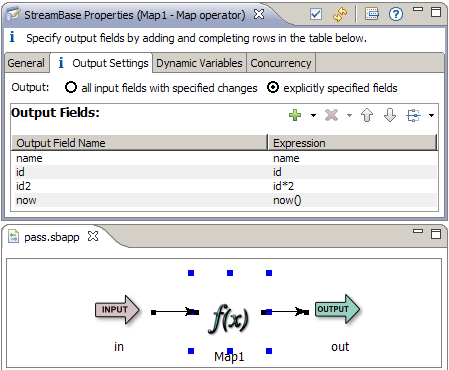
This StreamBase application, which we named pass.sbapp, contains an input stream with this schema:
| Field Name | Type | Size |
|---|---|---|
| name | string | 50 |
| id | int | 4 |
The input stream is connected to a Map operator named Map1 that adds to these fields:
-
An
id2field (expression isid*2). -
A
nowfield that contains the current time, derived from the built-innow()function.
You can compile your Java program with a command such as the following examples:
-
On Linux, make sure that the supported SDK or JDK version is on your system PATH. Then use the sb-config utility to compile and run your program:
javac `sb-config --classpath` SimpleMonitor.java -
On Windows:
javac -classpath "C:\Program Files\StreamBase Systems\StreamBase.n.m\lib\sbclient.jar" SimpleMonitor.java
As with all clients that interact with a StreamBase application, a StreamBase Server instance must be running.
Once the server has been started, you can run the client by entering commands such as the following. For best performance,
we also recommend that you use the -server option with the java command, to select the server VM:
-
On Linux:
java -server -classpath `sb-config --classpath`:. SimpleMonitor -
On Windows:
java -server -classpath "C:\Program Files\StreamBase Systems\StreamBase.n.m\lib\sbclient.jar" SimpleMonitor