This page describes the use of LiveView Desktop charting view. Charting view queries let you examine your data with various visual representations, such as heat maps, line graphs, pie charts, and many other views.
Note
LiveView Desktop charting view requires Java 1.6, or Java 1.7 with update version u40 or higher. Charting capability is not available when using Java 1.7u39 or lower.
This section uses the Hello LiveView sample and shows important features of the charts in the example's preconfigured workspace.
Load and run the Hello LiveView sample as delivered with LiveView, and view the resulting tables with LiveView Desktop. Follow these steps:
-
Start StreamBase Studio in the SB Authoring perspective.
-
Load the Hello LiveView sample:
-
Select → from Studio's top-level menu.
-
Enter
helloin the filter field to narrow the selection. -
Select the sample whose description is
Shows a
                          simple Hello World application
from the TIBCO LiveView category. -
Click .
The Hello LiveView sample loads into Studio with the project name
sample_lv-helloliveview. If you already have a project folder of that name, Studio adds a counter digit to the folder name and adds a new project. -
-
In the Package Explorer view, select the name of the project, right-click, and from the context menu, select → . The Console view shows several messages as the LiveView Server compiles the project and starts. This startup process can take several minutes, depending on the configuration of your computer.
-
When you see the message
All tables have been
                    loaded
in the Console view, start LiveView Desktop with one of the following methods:-
On Windows and Linux, if your StreamBase Studio sample project folder includes
Start LiveView Desktopentries, then a Run Configuration entry was automatically added to Studio when you loaded the sample. In this case, the simplest way to start LiveView Desktop is to invoke → → . -
On Mac OS X, only if LiveView Desktop is installed in the canonical location in
STREAMBASE_HOME/liveview/desktop, you can invoke → → .Otherwise, use Spotlight or Launchpad to locate and invoke the app named
liveview. -
On Windows, you can also invoke → → → → .
-
On Linux, you can also run the following command:
/opt/tibco/sb-cep/
n.m/liveview/desktop/liveview &
Any of these methods opens the Connect to LiveView dialog.
-
-
In the Connect to LiveView dialog, select the radio button for Download and click .
-
Select the workspace named
Hello LiveViewand versionLatest. -
Click . This returns you to the Connect to LiveView dialog. The Download field now contains
Hello
                    LiveView (Latest)
. -
Click .
LiveView Desktop opens on a workspace with several views. The chart in the preconfigured workspace contains a pie chart that looks something like this:
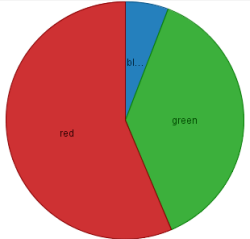
This query charts the amounts of items of each color in the total items. Your chart will not look exactly like this one since the amounts are generated with a Feed Simulation that uses a random number generator.
LiveView Desktop charting queries are configured through the Configure Charting View dialog. Click on the Configure button
(![]() ) in the query view's toolbar to open the Configure Charting View dialog.
) in the query view's toolbar to open the Configure Charting View dialog.
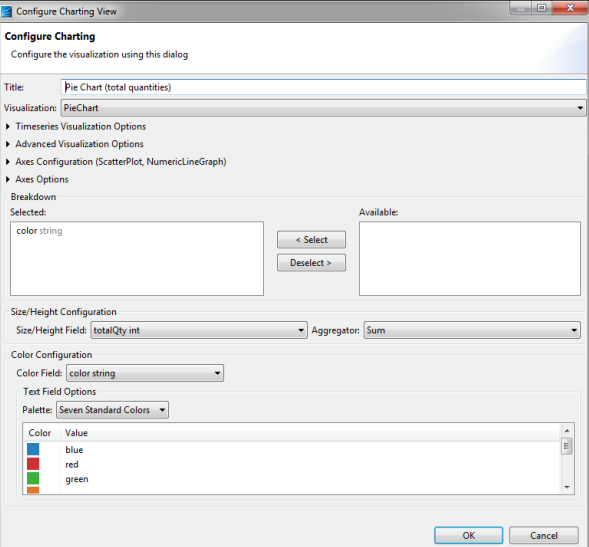
LiveView Desktop provides tools to control the open chart view.
-
The toolbar for a charting query contains custom buttons:
-
The Show Color Legend button (
 )
toggles the color legend on and off.
-
The Show Time Series Ruler button (
 ) is active when the chart is a time series plot.
-
The LiveView Desktop standard chart types are shown in the following table.
| Name | Description | Example |
|---|---|---|
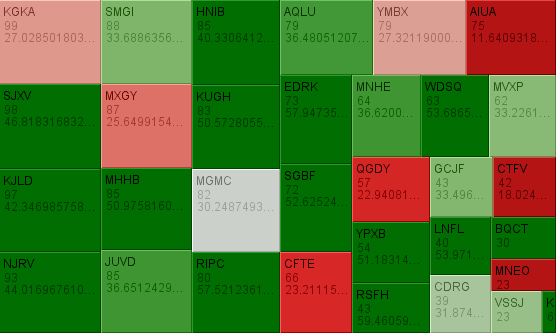
| Treemap |
Treemaps display large amount of hierarchical data as colored rectangles on a grid. The size of a field reflects its importance. The color conveys another property. This example shows a Treemap chart configured against the Items table. |
|
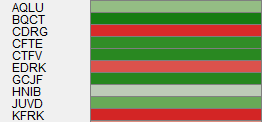
| Heatmatrix | Like a treemap, but represents each data group as a rectangle. The color of the square corresponds to the importance. |
|
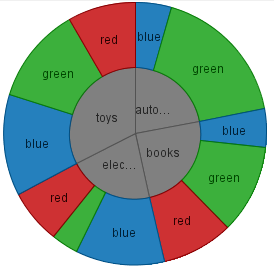
| Pie chart | Displays quantities as parts of the whole. |
|
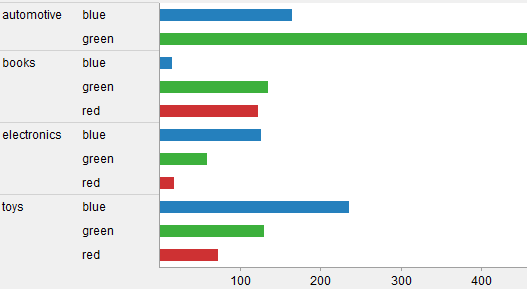
| Bar graph (horizontal) | Length represents quantity. |
|
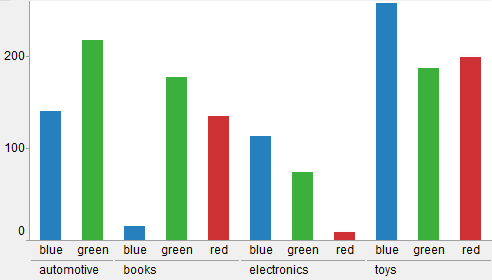
| Bar graph (vertical) | Height represents quantity. |
|
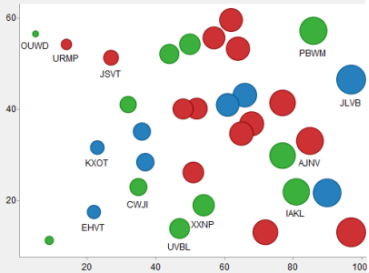
| Scatter plot | Plot on two axes, with size and colors for additional quantities. |
|
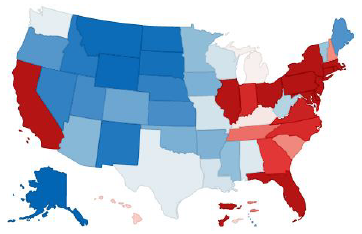
| Shapes | Display data for an SVG path. These plots show how both physical location and size are important by showing geospatial correlations. |
|
LiveView supports the following time series charts. For these chart types, the table must have one or more fields of type timestamp. The timestamp field is represented on the horizontal (X) axis.
| Name | Description | Example |
|---|---|---|
| Line Graph | Dependent variable represented as a point. The height of the point represents the quantity of interest. Successive points are connected by straight-line segments. |

|
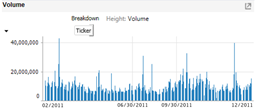
| Needle Graph | Dependent variable represented as a vertical line. The height of the line represents the quantity of interest. |
|
| OHLC (Open-High-Low-Close)/Candle Stick | Time-based price distribution for a specific time window. For each time window, the highest price, lowest price, opening price, and closing price are shown. |

|
