Concepts
This section describes ibi Data Quality key concepts, facilities, and terminology you should familiarize yourself with prior to using the product.
Data Class
In ibi Data Quality, a Data Class represents a real-world entity.
Example: SSN, Credit Card, Email
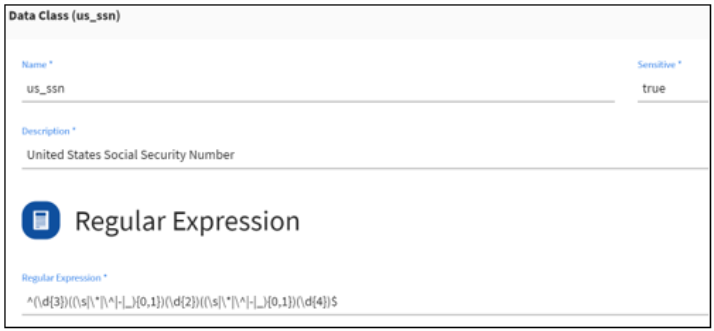
Data classes are associated with a Sensitive Data flag to identify data classes that represent data objects containing confidential information.
The ibi Data Quality Profiler uses metadata classification algorithms to classify data attributes and associate them with known Data Classes. The ibi Data Quality Knowledge Hub provides the definitions for all the Data Classes that can be recognized by the Profiler. Users can review a list of Data Classes from the Data Class tab on the user interface. Users can also add new or custom Data Classes using the Data Class Editor.
For more information, see Managing Data Classes.
A sample definition for the built-in Data Class called us_ssn is shown below.
Rule
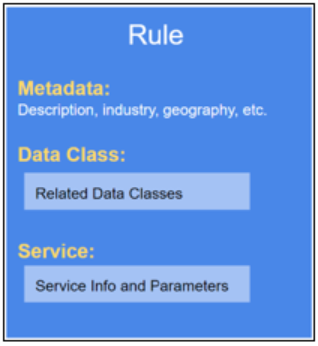
In ibi Data Quality, a Rule represents an implementation of a Service that can validate, cleanse, and/or enrich a class of data.
- Rules are implemented via Services.
- Rules are created by configuring Service parameters.
- Rules are associated with metadata such as description, data class, entity, industry, country, etc.
- Multiple Rules can be created using a single Service.
Example: cleanse_ssn, cleanse_payment_card, cleanse_email
The ibi Data Quality delivers a set of sample Rules for known Data Classes. Users can author new Rules using the Rules Editor. For more information, see Managing Rules.
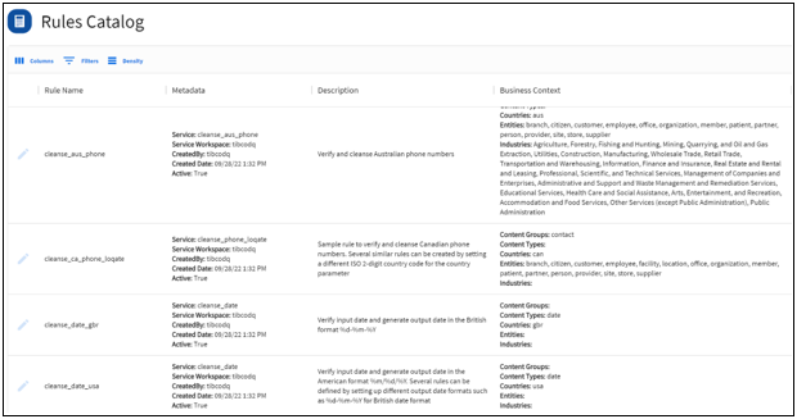
Rules Catalog
Users can search the Rules Catalog and find Rules to associate with different data attributes. Rules are configured with Rule metadata that provides users additional context to find the most appropriate Rules for their data. Rule metadata generally includes Description, Data Classes, Industries, Geographies, Entities, etc.
Authoring
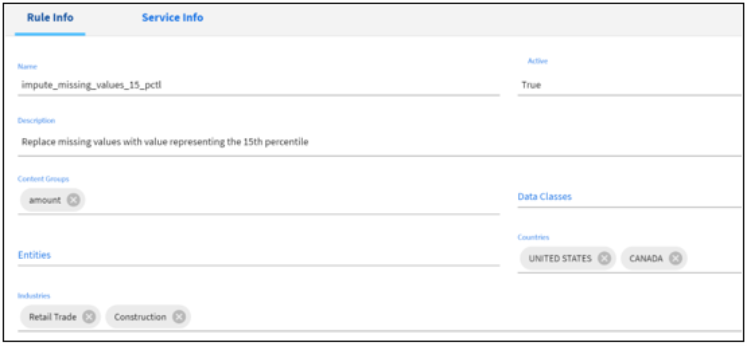
Users can define and add new rules using the Rules Editor.
Rules are generally associated with metadata to provide the context in which it should be executed. Rules are created and managed in the Rules Editor where the author specifies the rule metadata, selects a Service and configures the Service parameters. Multiple Rules can be created using a single Service.
For more information, see Managing Rules.
Service
In ibi Data Quality, a Service represents a workflow that contains the logic to cleanse, validate, and enrich input data.
- Services can be generic or domain-specific.
Examples:
- Generic: cleanse_date, compare_values
- Domain-specific: cleanse_ssn, cleanse_payment_card, cleanse_email
- ibi Data Quality delivers a set of prebuilt services.
- ibi Data Qualityships with containers that host product delivered Services and DQS Services (if the customer opts to add DQS as a Service Producer).
- All other Services have to be hosted outside ibi Data Quality and published as a RESTful Service that can be accessed by ibi Data Quality.
- Users can test and register new Services using the API.
For more information, see Managing Services.
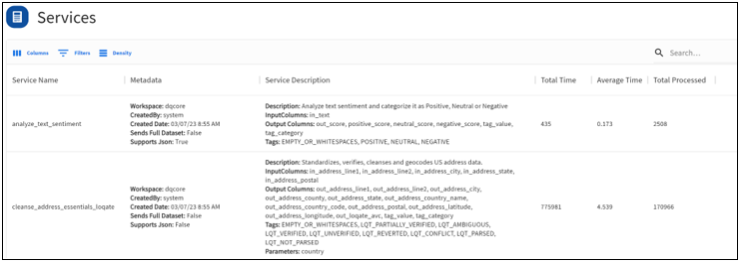
Service Catalog
Users can search and find the different services registered in their environment. The Service Catalog shows service description, metadata, and operational metrics such as number of requests executed and the execution time.
Authoring
Developers can author a data quality workflow in any language or tool and deploy it as a RESTful Service. Services have to comply with ibi Data Quality service requirements. For more information, see DQ Service Requirements.
Customers can also opt to purchase a license for ibi Omni-Gen Data Quality Server (DQS) to build DQ plans and deploy them into the DQS container. For more information, see Managing Services.
Registration
Developers can test and register new Services using the Register Services API. For more information, see Managing Services.
Execution
In ibi Data Quality, client applications can execute a DQ Service request via Rules. Clients cannot send direct requests to Service endpoints.
Note: In order to execute a DQ Service, you must create a Rule that references the Service.
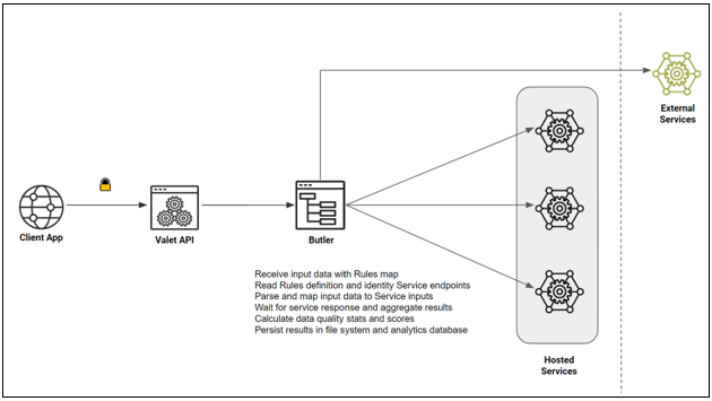
When a client application submits a request to execute a set of Rules against input data attributes, ibi Data Quality reads the Rule definitions, parses and maps the data attributes to Service inputs, routes the requests to the corresponding Service endpoints, aggregates the responses for all the Service requests, generates data quality stats and metrics, and persists the results in file system and the analytics database.
Multiple Rules Using One Service
This is a simple illustration of a single Service used to create multiple Rules in ibi Data Quality. We are going to use a built-in Service named cleanse_date that takes input date values in any format, automatically infers the input date format, verifies if the date values represent valid calendar dates, and produces output dates in the user-specified format.
Service Details:
- Name: cleanse_date
- Inputs: in_date
- Outputs: out_date, date_format, tag_value, tag_category
- Parameters:
- default_date: A default date value that is used to replace invalid or missing date values in the output.
- date_format: Date format to represent valid or cleansed output dates.
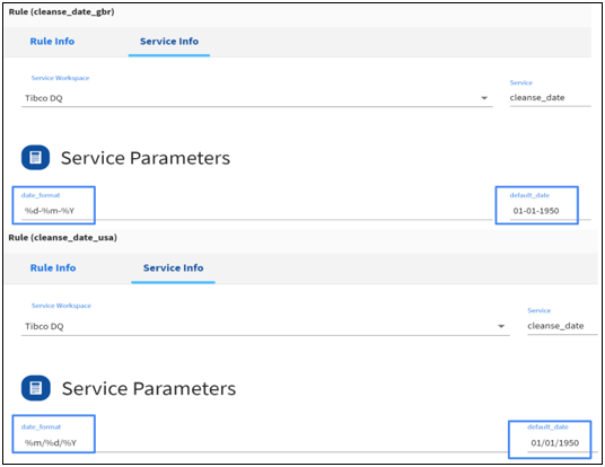
We are going to define two Rules by specifying different values for the Service Parameters.
- cleanse_date_usa will generate output dates in “%m/%d/%Y” format and will default invalid or missing dates to 01/01/1950.
- cleanse_data_gbr will generate output dates in “%d-%m-%Y’ format and will default invalid or missing dates to 01-01-1950.
As shown below, both of these Rules refer to the same Service, but are configured with different values for the Service parameters. For more information on how to create new Rules, see Adding New Rules.
Data Profiling
The ibi Data Quality Profiler performs technical analysis of data to generate output, such as:
- Number of columns, data types, data classes.
- Completeness, uniqueness, patterns, masks, etc.
- Advanced options: Dedup data, discover correlations, identify outliers.
- Profiling scores: A score that reflects the trustworthiness of the data both at the column level and at the data set level.
When users upload a new data set, they have the ability to add the source metadata. They also have the ability to select the data attributes for profiling analysis and can set up various data expectations. User defined data expectations for an input data set factor into the calculation of Profile and DQ Scores for that data set.
Data expectations that can be set by the user:
- Column values should be unique.
- Column values can be null.
- Column values have high, medium, or low business impact.
The ibi Data Quality Profiler generates detailed results in JSON format and stores the detailed results in the file system. It also persists key statistics and metrics in the analytics repository. ibi Data QualityProfiler cannot be customized by users.
Data Quality (DQ) Analysis
In ibi Data Quality, Rules are used to perform Data Quality (DQ) analysis. DQ analysis involves cleansing (removing junk or unexpected characters), standardization (reformatting to a consistent format), verification against a series of tests to ascertain that the values accurately represent the intended real-world entity, and data enrichment (imputing missing values or augmenting data from reference data sources).
In general, DQ analysis of an input data set results in the following output values:
- output value. Cleansed, fixed, or enriched value whenever issues are detected.
- tag_value. Tags to represent issues or reportable facts identified during the DQ analysis.
- tag_category. Final outcome of the analysis (VALID, INVALID, MISSING, or CLEANSED).
- score. A score that reflects the trustworthiness of the data at the column level and at the data set level.
Scoring
The ibi Data Quality delivers two sets of scores: Profile Scores and Data Quality (DQ) Scores
In order to get accurate scores, it is recommended that users provide the source metadata and configure their expectations of the data.
Source Metadata
- Source Name. Name of the data source.
- Source Type. An indicator whether the data source is “INTERNAL” or “EXTERNAL” to the business entity.
- Application Name. Name of the application within the source that is generating the data (for example, ERP-Prod).
- Industry. Optional industry reference for the data (for example, Retail).
- Entity. Optional business entity reference for the data (for example, Product).
Data expectations that can be set by the user:
- Column values should be unique.
- Column values can be null.
- Column values have high, medium, or low business impact.
Profile Score
The ibi Data Quality Profiler compares the profiling results against data expectations set by the user to calculate individual scores for each data attribute and a summarized score for the complete data set.
Users are required to set up the following data expectations to get accurate profile scores:
- Column values should be unique. User expects values in the data attribute to be unique.
- Column values can be null. User does not always expect a value for the data attribute.
- Business impact. An indicator of how the quality of data in this data attribute affects downstream business applications (HIGH, MEDIUM, or LOW).
Profiling stats for individual data attributes are scored against the first two expectations. Overall profile score is calculated as a weighted average score that applies business impact as weights to the individual data attribute's profiling scores.
Data Quality (DQ) Score
The ibi Data Quality calculates DQ scores for each data attribute or a group of data attributes that is mapped to a Rule and also generates a summarized score for the complete data set. Users are required to set up the following expectation to get accurate DQ scores:
- Business impact. An indicator of how the quality of data in this data attribute affects downstream business applications (HIGH, MEDIUM, or LOW).
DQ stats for individual data attributes are scored against tag categories. The overall DQ score is calculated as a weighted average score that applies business impact as weights to the individual data attribute’s DQ score.