Joining Data Sources
If you select more than one data source for your data flow, you must use a Join object to connect them.
You need to specify the common column or columns that will link the tables, as well as the type of join.
You can perform an inner, left outer, right outer, full outer, or cross join.
- An inner join extracts those rows that appear in both tables. This is the default.
- A left outer join includes all of the rows from the table listed in the Left Source Columns grid, and the columns from the Right Source Columns grid that match one of these columns.
- A right outer join includes all of the rows from the table listed in the Right Source Columns grid, and the columns from the Left Source Columns grid that match one of these columns.
- A cross join is a Cartesian product of two tables. It consists of all possible pairs of rows from the two tables.
- A full outer join includes all of the rows that are extracted from both data sources.
When you link data sources, ibi Data Migrator identifies each table with Tn, where n is the order in which the table was chosen. For example, the first source chosen would be identified as T1, the second as T2, and so on.
ibi Data Migrator creates join syntax in ANSI 92 SQL. For example, when selecting the tables Product and Vendor, and columns VENDORNUM and VENDOR_NUM, ibi Data Migrator generates the SQL syntax:
SELECT...FROM

Product t1 INNER JOIN VENDORS T2 on t1.vendornum=T2.vendor_num
Considerations for Join Performance
ibi Data Migrator lets you create joins across similar data sources, different data sources, and across servers (also known as cross-platform joins).
In general, cross-platform joins, and joins without key fields, can create many intermediate files, depending on the number of tables joined. This issue may be less significant for some platforms. For example, the Server for z/OS can use hyperspaces and alternate sort utilities. If performance is a concern, you should carefully evaluate the impact of your joins.
To improve performance, try any of the following:
- Minimize the number of tables used in a join.
- Join tables using key columns and indexes, when possible.
- Make sure that the smaller of the two tables is selected first, and the larger one is selected second.
Automatically Add Join Objects
The default settings of the ibi Data Migrator desktop interface automatically create Join objects. If Join objects are not being created, you can change your settings so that Join objects are created automatically.
- Procedure
- On the Home tab, in the Tools group, click Options.
- Expand Data Flow and select Data Flow Designer from the tree.
- Select the Add Join Object if needed checkbox in the On Add Source section.
- Click OK.
Join Data Sources
If the ibi Data Migrator desktop interface is using the default settings, Join objects are created automatically when you drag additional data sources into the data flow workspace.
You can also add a join by right-clicking in the data flow workspace and selecting Add Join. In that case, you must connect the data source to the join by right-clicking it and dragging it to the Join object.
- Procedure
- To complete the join, double-click
the Join object, or right-click a Join object and select Join
Editor.
The Join Editor dialog opens, listing the columns from the two data sources in the Left and Right Source Columns lists. For more information, see Join Editor dialog.
If the two data sources have a column with the same name and format, and that column is a key column in one of the sources, an inner join will automatically be created for those columns. This default join can be changed, if necessary.
- If you
want to join columns with different names, select one column from
each list, and click the equal sign to create the join.
The equality condition will appear in the Expression box under Join Conditions.
ibi Data Migrator supports both equi and non-equi (conditional) joins. In an equi-join, the condition is one of equality, while a non-equi join uses any other condition, such as greater than, less than, and so on.
Note: You can delete the condition from the Expression box by selecting it and clicking the Delete Condition button.You can edit the condition by selecting it in the Expression box and clicking the Edit Condition button.
- Select
the type of join you want from the Join Type dropdown menu, by clicking
the join diagram, or right-clicking anywhere in the diagram and
selecting a join type from the menu.
- Click the area where the circles intersect for an inner join. This is the default.
- Click the left circle for a left outer join.
- Click outside the circles for a cross join or Cartesian product.
- Click the right circle for a right outer join.
- Click an inner circle a second time for a full outer join.
The type of join you create will be graphically displayed in the workspace.
- To add a calculation or SQL function to the condition, select it and click the Edit Condition button. When the Join Calculator opens, enter your calculation in the Conditions box by typing it, or by using the Columns/Variables and Functions tabs and the calculator buttons. For details, see Join Calculator. For information about using functions, see Using an SQL Function. For information about using variables, see Using Variables in a Flow.
- To define a new condition, click the Insert Condition button, which will launch the Join Calculator. This is where you can create the condition.
- Click the Test Join button to test the join.
- Click OK to save the join.
- Drag another synonym into the workspace, to the left of the SQL object.
- Double-click the second Join object.
- Select
one column from each list, and click the equal sign to create the join.
The equality condition will appear in the Expression box under Join Conditions.
- Click OK.
An example of a data flow with three joined sources is shown in the following image.

Join Objects in the Workspace
Join objects appear as follows in the workspace:
|
Object |
Function |
|---|---|
|
|
Inner Join Indicates that the two data sources are connected by an inner join and that only rows that appear in both tables used in the Join are extracted. |
|
|
Left Outer Join Indicates that the two data sources are connected by a left outer join and that all rows are extracted from the left data source, as well as the columns from the right source that match. |
|
|
Right Outer Join Indicates that the two data sources are connected by a right outer join and that all rows are extracted from the right data source, as well as the columns from the left source that match. |
|
|
Full Outer Join Indicates that the two data sources are connected by a full outer join and that all rows are extracted from both data sources. |
|
|
Cross Join Indicates that the two data sources are connected by a cross join, or Cartesian product of two tables. It consists of all possible pairs of rows between the two tables. |
Create a Join Condition With the Join Calculator
- Procedure
- From the
Join Editor dialog, click the Add new row button,
and then click the Calculator button.
The Join Calculator opens.
- Enter your calculation in the Expressions box by typing it, or by using the Columns/Variables and Functions tabs and the calculator buttons. For information about using functions, see Using an SQL Function. For information on using variables, see Using Variables in a Flow.
- Click OK.
Edit a Join Condition With the Join Calculator
- Procedure
- From
the Join Editor dialog, select the condition and click the Edit
Condition button.
The Join Calculator opens.
- Edit your calculation in the Expressions box by typing it, or by using the Columns/Variables and Functions tabs and the calculator buttons.
- Click OK.
Join Editor dialog
To access the Join Editor dialog from the workspace, double-click a Join object, or right-click a Join object and select Join Editor.
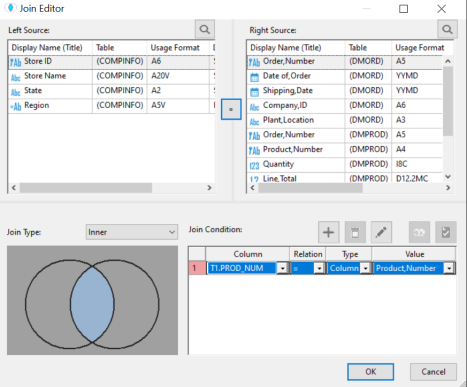
The Join Editor dialog contains the following fields and options:
Displays the available columns from the first data source.
Next to each column name, there is a symbol that indicates regular columns, key columns, index columns, or virtual columns.
Displays the available columns from the second data source.
Establishes the relationship between the selected columns as equal.
 Find
Find
Allows you to search for a column.
Adds a row to create an additional condition.
Deletes the selected condition.
Opens the Join Calculator to edit a condition.
 Join Profiler
Opens the Join Analysis window, where the join condition is analyzed to show the number of rows and distinct rows that would result from a left outer, inner, and right outer join.
Tests the join conditions.
Lists the conditions by which the two data sources are connected.
Enables you to select the join type from the dropdown menu or by clicking in the join diagram, which graphically represents the type of join being used.
Join Calculator
To access the Join Calculator from the Join Editor dialog, select a row, and click the Edit Condition button.
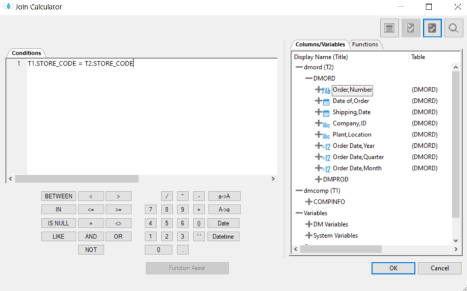
The Join Calculator contains the following fields and options:
Displays the expression.
Displays available columns and variables.
Displays a list of SQL functions that are available for your transformations.
Allows you to specify parameters for the function through a dialog when creating or editing a transformation.
Insert numbers and operators.
The following operators are available in both the Join and Filter calculators:
Specifies data will be returned if the value of the field falls between the values entered on either side of the word AND. For example:
RETAIL BETWEEN 20 AND 30
For alphanumeric data, this option specifies data will be returned if the field value is a substring of the right operand.
Specifies that records with a null value for the specified column are returned.
Returns data if the value of the field matches the character string on the right operand. In the character string, use the underscore character (_) to represent any single character, and the percent character (%) to represent any sequence of characters. For example, the following string returns the value TRUE if LAST_NAME contains the string SMITH anywhere inside it (for example, SMITH, SMITHSON, SILVERSMITH):
LAST_NAME LIKE '%SMITH%'
The following string returns the value TRUE if LAST_NAME is exactly five characters long and the first letter is S.
LAST_NAME LIKE 'S_ _ _ _'
Returns data if the value of the field is less than the right operand. For example, the following string restricts the query to those employees who earn less than $30,000:
SALARY < 30000
Returns if the value of the field is less than, or equal to the right operand.
Specifies data if the field value equals the right operand.
Is used in combination with the BETWEEN operator.
Is used in combination with other relational operators to negate them. For example, the following string returns all records where the value of LAST_NAME is not null:
LAST_NAME IS NOT NULL
Specifies data will be returned if the value of the field is greater than the right operand.
Specifies data will be returned if the value of the field is greater than, or equal to the right operand.
Specifies data will be returned if the left operand is not equal to the right operand.
Inserts the operator OR.
Adds parentheses.
Inserts two single quotation marks (‘). Enter alphanumeric test values between these.
Converts selected text to uppercase.
Converts selected text to lowercase.
Opens the Date Editor window, which lets you use the current date or specify a date from the calendar.
Opens the Date Editor window, which lets you use the current date and time or specify a date and time from the calendar.
Join dialog
To access the Join dialog from the Join Editor dialog, click the button, and then click .

The Middle column shows the number of rows (Count) and unique rows (Distinct Count) that the entered join criteria would return for an Inner join.
The Left and Right columns show the number of additional values and rows that would be returned for their respective join type.
From the example shown in the above image, a Left outer join would return 95 additional rows with 95 unique values, in addition to the rows returned by the inner join.
Note that all of the numbers in each row or column are also hotlinks. For example, if you double-click 43, a Test Results window opens, as shown in the image below. This window shows the 43 values for Store ID that were in the left source, but that were not found in the right source.

Join Profiler
To access the Join Profiler from the Join Editor dialog, click the Join Profiler button.

The top area displays the Profiler chart. The chart shows a vertical bar chart that represents the number of rows that would be returned from each table when a Left Outer, Right Outer, or Inner Join is run.
The bottom area displays the Profiler report, which shows the number of rows returned based on the join criteria.
- The first row shows, for the left and right data sources, how many rows would be excluded based on the join criteria.
- The second row shows, for the left and right data sources, how many rows would be included based on the join criteria.
- The third row shows how many rows would be returned based on the join criteria.
- The Left and Right columns show the number of additional values and rows that would be returned for their respective join type.
From the example shown in the above image, an inner join would exclude 575 rows from the left data source.
Note that all of the numbers in each row or column are also hotlinks. For example, if you double-click 575, a Test Results window opens, as shown in the left area. This window shows the 575 values for Customer ID that were in the left source, but that were not found in the right source.
Join Profiler dialog
To access the Join Profiler dialog from the Join Editor dialog, click the Join Profiler button, and then click Join Profiler.
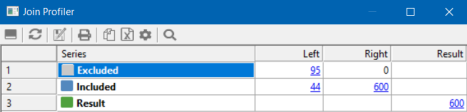
The first row shows, for the left and right data sources, how many rows would be excluded based on the join criteria.
The second row shows, for the left and right data sources, how many rows would be included based on the join criteria.
The third row shows how many rows would be returned based on the join criteria.
The Left and Right columns show the number of additional values and rows that would be returned for their respective join type.
From the example shown in the above image, an inner join would exclude 95 rows from the left data source.
Note that all of the numbers in each row or column are also hotlinks. For example, if you double-click 44, a Test Results window opens, as shown in the following image. This window shows the 43 values for Store ID that were in the left source, but that were not found in the right source.
Join Profiling Chart
To access the Join Profiler Chart from the Join Editor dialog, click the Join Profiler button, and then click Join profiler chart.
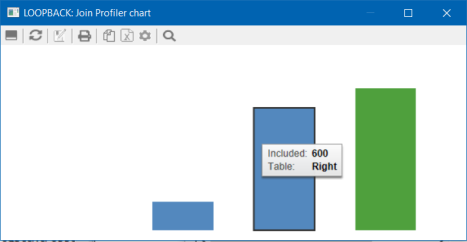
The chart shows a vertical bar chart that represents the number of rows that would be returned from each table when a Left Outer, Right Outer, or Inner Join is run.
Join Sampling
To access the Join Sampling report from the Join Editor dialog, click the Join Profiler button, and then click Join sampling.

The report shows, for each value of the join fields, the number of rows returned and whether each row was returned from the left and right sources.
Test Individual Join Window
To access the Test Individual Join window from the Join Editor window, select a join and click the Test Join button. Sample data from the join will be shown, as shown in the following image.

Join Profiler Buttons
Each report returned by the Join Profiler has the following options.
 Run Options
Opens a dialog for entering or selecting the following run options:
- Maximum number of rows for test reports. The default value is 50.
- Maximum number of columns for test reports. The default value is 999999.
- Test reports default format. The default value is Default. Other selections are HTML, HTML - plain text, Active Report, PDF, or Unformatted.
- Omit missing (null) values in Data Profiling charts. This box is deselected, by default. To omit null values, check this box.
- Show all Values in Data Profiling Reports. Returns all values in a data profiling report, regardless of the sampling size indicated in the Maximum number of columns for test reports field.
- Defaults for New Flows:
Stop processing if 0 rows selected. This option is selected by default.
Stop after DBMS errors: The default value is 10000000.
 Refresh
Refreshes the current document.
 Save As
Opens the Save As dialog to save the active document, with a new name.
 Print
Print
Prints the active document.
 Copy as Text
Copies selected data as text. You can paste it into any type of file that accepts text input.
 Export to Excel
Exports selected data to Excel.
 Options
Enable you to choose the columns to display or restore the display to the defaults.
 Find
Find
Opens the Find dialog. You can enter text to search for in the active document. You can choose to search backward or forward (the default), match case, and search for whole words only.
Join Profiler Buttons
Each report returned by the Join Profiler has the following options.
 Run Options
Opens a dialog for entering or selecting the following run options:
- Maximum number of rows for test reports. The default value is 50.
- Maximum number of columns for test reports. The default value is 999999.
- Test reports default format. The default value is Default. Other selections are HTML, HTML - plain text, Active Report, PDF, or Unformatted.
- Omit missing (null) values in Data Profiling charts. This box is deselected, by default. To omit null values, check this box.
- Show all Values in Data Profiling Reports. Returns all values in a data profiling report, regardless of the sampling size indicated in the Maximum number of columns for test reports field.
- Defaults for New Flows:
Stop processing if 0 rows selected. This option is selected by default.
Stop after DBMS errors: The default value is 10000000.
Refresh
Refreshes the current document.
Print
Prints the active document.
Copy as Text
Copies selected data as text. You can paste it into any type of file that accepts text input.
Find
Opens the Find dialog. You can enter text to search for in the active document. You can choose to search backward or forward (the default), match case, and search for whole words only.
Join Object Options
After a join has been added to the workspace, the following options are available in the shortcut menu:
Opens or closes a window that allows you to view the join expression and sample data.
Opens the Join Editor which allows you to create or edit the join conditions.
Opens a submenu with the following options. Note that these options are only available when the Join object does not already have two inputs.
- Source. Opens the Select Synonym panel to add a new synonym to the data flow connected to this Join object. When adding the second synonym the Select Synonym opens with Show synonyms with matching keys filter already enabled.
- Join. Adds a new Join object as input to this Join object.
- Select. Adds a new Select object as input to this object.
- Union. Adds a new Union object as input to this object.
Deletes the selected Join object.
Opens the Properties panel for the selected Join object.
Displays a dialog with an error message. This option is only available if there is an error. For more information, click Details.