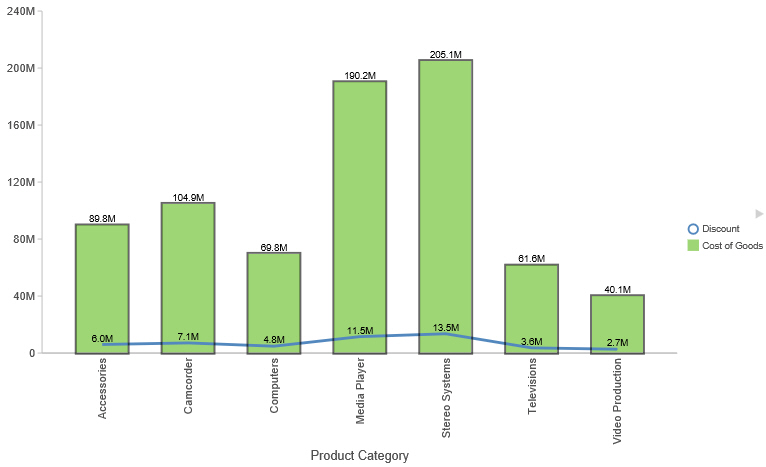
Associated Dialog Boxes
|
In this section: |
Whether you access data label options from the ribbon or the shortcut menu, you are presented with a dialog box of options. The following dialog boxes are commonly used for formatting data labels:
- Format Labels
- Style
- Line Style
For instructions on how to open these dialog boxes, see the procedures in Using Data Labels Properties.
Format Labels Dialog Box
The Format Labels dialog box contains options for editing data labels. The Format Labels dialog box offers different options depending on the chart type that you are using. Bar, line, and area charts share the same tabs.
The Format Labels dialog box contains the following tabs:
- General Options
- Advanced
- Pie Title (for pie charts only)
- Pie Labels (for pie charts only)
- Funnel Labels (for funnel and pyramid charts)
General Options Tab
Use the General Options tab to add data labels to a chart and set their position, angle, and radius.
The General Options tab is shown in the following image.
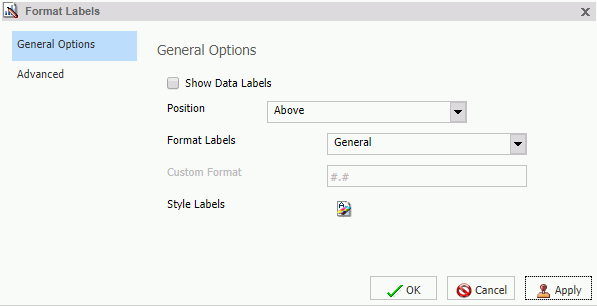
The General Options tab contains the following options:
- Show Data Labels. Select this option to show data labels on a chart. Clear this option to suppress data labels.
- Position. Select
an option from this drop-down menu to determine where the data label
will be positioned. The options are:
- Above
- Below top edge
- Center
- Base
- Center back
- Format Labels. Select from this drop-down menu of preset formats that can be applied to the labels. Some of the options include Use Pattern, Currency General, and Date Full.
- Custom Format. Enter
a standard number format pattern for the data label. This option
is only available when you select the Use Pattern option
from the Format Labels drop-down menu.
The following table describes the characters that you can use in a custom format.
Character
Description
#
Is a digit.
0 (zero)
Shows as absent.
. (period)
Is a placeholder for decimal separator.
, (comma)
Is a placeholder for grouping separator.
; (semicolon)
Separates formats.
- (dash)
Is the default negative prefix.
% (percent)
Divides by 100 and shows as a percentage.
x
Determines that any other characters can be used in the prefix or suffix.
‘ (apostrophe)
Is used to quote special characters in a prefix or suffix.
- Style Labels. Click this icon to open the Style dialog box, where you can style text. For more information, see Style Dialog Box.
- Show Cumulative Sums. Select this option to have the data text labels show cumulative sums. Clear this option to have data text labels show individual sums. This option is available for stacked charts.
- Show Stacked Total. Select this option to display stacked totals. Data position should be set to Center to display a stacked total. This option is available for stacked charts.
Advanced Tab
Use the Advanced tab to modify additional data labels properties.
The Advanced tab is shown in the following image.
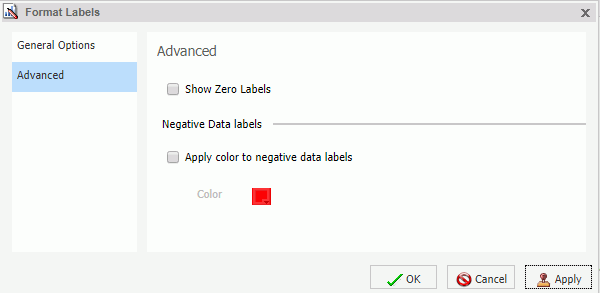
The Advanced tab contains the following options:
- Show Zero Labels. Select this option to display zero values in a chart. Clear this option to display all data values except zero.
- Apply color to negative data labels. Select this option to style negative data labels separately from positive data labels.
- Color. Click this icon to open the Color dialog box, where you can select a color for the negative number.
Pie Labels Tab
Use the Pie Labels tab to customize your pie data labels.
The Pie Labels tab is shown in the following image.
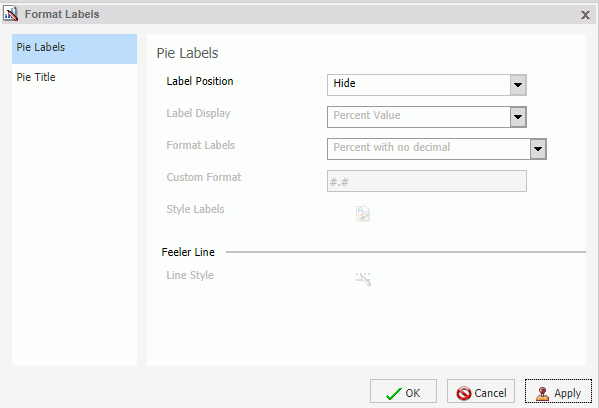
The Pie Labels tab contains the following options:
- Label Position. Select from this drop-down menu an option to control the display of feeler lines and labels on a pie chart.
- Label Display. Select from this drop-down menu an option to control the format of labels displayed next to feelers on a pie chart.
- Format Labels. Select from this drop-down menu of preset formats that can be applied to labels.
- Custom Format. Select this option to use a custom format from a list of preset formats. See the following table for a list and description of the characters that you can use in a custom format.
- Style Labels. Click this button to open the Style dialog box, where you can style text.
Ring Label. These options appear on the tab for a ring pie chart.
- Show Ring Label. Select this option to control the display of the total label on a pie ring chart.
- Format Labels. Select from this drop-down menu of preset formats that can be applied to labels.
- Custom Format. Enter a standard number format pattern for the data label. This option is only available when you select the Use Pattern option from the Format Labels drop-down menu.
- Style Labels. Click this button to open the Style dialog box, where you can style text.
Feeler Line. Provides options to style the feeler lines for pie chart labels.
- Line Style. Click this button to open the Line Style dialog box, where you can edit the color, weight, and style of the feeler line.
Pie Title Tab
Use the Pie Title tab to create and style a pie title.
The Pie Title tab is shown in the following image.
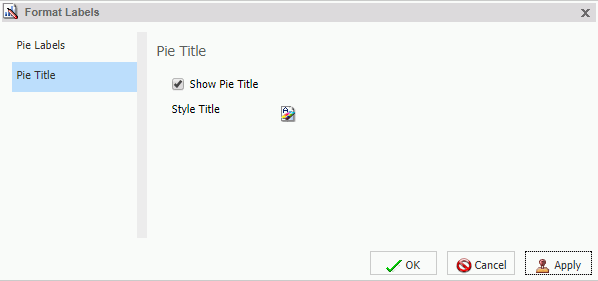
The Pie Title tab contains the following options:
- Show Pie Title. Clear this option to suppress a pie title. Select this option to display a pie title. This is the default option.
- Style Title. Click this icon to open the Style dialog box, where you can style pie title text.
Funnel Labels Tab
Use the Funnel Labels tab to customize the labels on a funnel or a pyramid chart.
The Funnel Labels tab is shown in the following image.
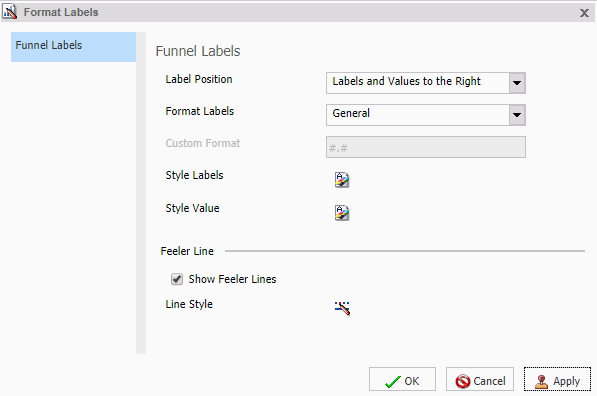
The Funnel Labels tab contains the following options:
- Label Position. Select an option from this drop-down menu to control the display of feeler lines and labels on a funnel chart.
- Format Labels. Select from this drop-down menu of preset formats that can be applied to labels.
- Custom Format. Select this option to use a custom format. See the table in the previous section for a list and description of the characters that you can use in a custom format.
- Style Labels. Click this button to open the Style dialog box, where you can style text.
- Style Value. Opens the Style dialog box, where you can style the value.
Feeler Line
- Show Feeler Lines. (Default) Clear this option to suppress feeler lines. Select this option to display feeler lines.
- Line Style. Click
this button to open the Line Style dialog box, where you can edit
the color, weight, and style of the feeler line.
Note: While some style options, such as Show Pie Title and Show Feeler Lines, are enabled by default, a stylesheet applied to the chart may contain different settings that will override these default settings.
Style Dialog Box
The Style dialog box contains options to style the data labels.
The Style dialog box is shown in the following image.
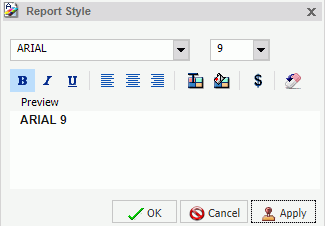
The Style dialog box contains the following options:
- Font. Use the drop-down menu to change the font.
- Font size. Use the drop-down menu to change the numeric value for the font size.
- Font style. Click the appropriate button (bold, italic, underline) to style the selected text.
- Text alignment. Click the appropriate button (left, center, right) to align the selected text.
- Font color. Click the button to open the Color dialog box, where you can select the font color.
- Reset to Quick Styles from Template. Click
the button to reset all settings to the default settings from the
template.
Note: Reset only works while the Style dialog box is open. Once you click OK, all changes are committed. To undo global styling after it has been committed, you must use the Undo command on the Quick Access Toolbar.
Line Style Dialog Box
The Line Style dialog box contains options to style lines on a chart.
The Line Style dialog box is shown in the following image.
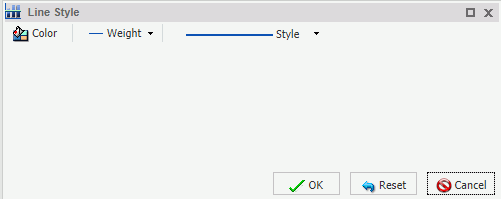
The Line Style dialog box contains the following options:
- Color. Click this button to open the Color dialog box, where you can select the color for the line.
- Weight. Click this button to open a drop-down menu of line weight options.
- Style. Click this button to open a drop-down menu of line style options.
- Reset. Click this button to reset the line to the default options.
