How Slicers Cascade Together
|
How to: |
Slicers cascade within a hierarchy (cube or dimension builder-based), rather than in the order of user interaction, eliminating potential performance issues.
Procedure: How to Cascade Slicers
Controls with fields from the same hierarchy are cascaded together.
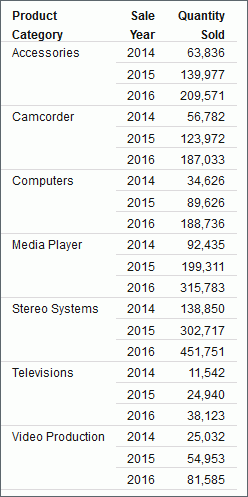
In the following example, a report has been created that shows the quantity of products, by category, sold each year.

- Create a report.
- Create multiple
slicer groups, as described in How to Create a Slicer.
In the following example, two groups have been created for this report: Product and Time (Sales). Both are from hierarchies, so they will cascade.
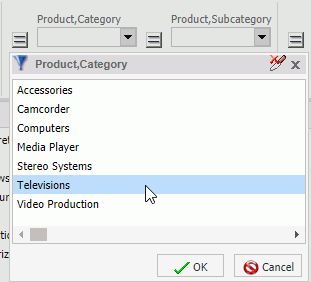
In the next example, Televisions is selected as the first control for the Product group.
Note: You can select multiple values by holding down the Ctrl key while selecting items in the drop-down list box. In cases where multiple items are selected, the label for the drop-down list is set to Multiple. You can click the drop-down list to review the selections.

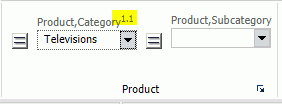
Once you click OK, the new control appears in the drop-down menu.

The 1 prior to the decimal point indicates that this is the first cascade you have interacted with. The 1 after the decimal point indicates that it is the first control in that cascade.
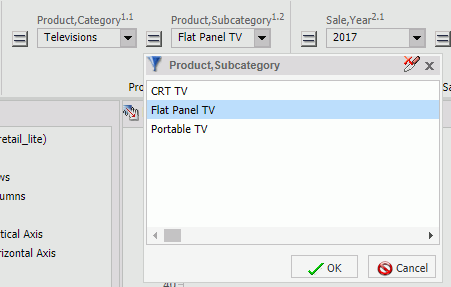
In the next example, Flat Panel TV is selected as the second control for the Product group, as shown in the following image. This is filtered to only show subcategories for Televisions.

Flat Panel TV appears in the Product Subcategory drop-down menu.
The number 1.2 indicates that this is the second control for the first cascade.
Now, a second group, Time (Sales) is created. It has two controls: the first is Sale,Year and the second is Sale,Quarter.
- Filter the
report using the controls in the slicer groups that you created.
In the following example, the report has been filtered to show the number of flat panel televisions that were sold in the first quarter of .
Note: The order of a cascade is dynamic. For example, if you selected Camcorder from Product Subcategory first, then the Product Category control would have a value of Video Production.