Creating a Compound Layout Report With Document Syntax
|
How to: |
|
Reference: |
Typically, you create a compound layout report by using the options in the Document canvas. Alternatively, you may create a compound layout report by modifying the syntax in any text editor.
Syntax for a compound layout report is structured by a compound layout block, which places all of the layout information in a single block that precedes the report. This block begins with a COMPOUND LAYOUT declaration and is terminated with END. The language it contains is based on StyleSheet syntax and is parsed by the StyleSheet parser.
This is supported with styled formats, such as PDF, PS, DHTML, EXL2K, or XLSX.
Tip: For details about StyleSheet syntax, see Creating and Managing a WebFOCUS StyleSheet.
The compound layout block consists of SECTION, PAGELAYOUT, and COMPONENT declarations. The general structure of the compound layout block of syntax is:
COMPOUND LAYOUT PCHOLD AS filename FORMAT format
SECTION
    PAGELAYOUT
      COMPONENT
      COMPONENT
    ...
    PAGELAYOUT
      COMPONENT
      COMPONENT
    ...
  ...
END
...
COMPOUND END
Note on Compound Layout Declaration: The available compound layout output formats are PDF, DHTML, PowerPoint, AHTML, Excel, FLEX, and APDF. The selected compound layout format will override any report output format from the individual components. The output file name can be defined using an AS filename phrase in the COMPOUND block. If none is defined, the file name is taken from the ON TABLE HOLD phrase in the first component report.
END signifies the end of the COMPOUND LAYOUT block, whereas COMPOUND END signifies the end of the compound report.
Additionally, the syntax SET COMPONENT=report(n) is added after each component, followed by the actual WebFOCUS code to generate the report.
Reference: SECTION Declaration and Syntax
A compound report section, or SECTION declaration, is a grouping of component reports within a compound report. While the current functionality only supports reports with a single section, this structure is used to support more complex reports. The SECTION declaration is mandatory when creating a compound layout report.
The SECTION syntax appears as:
SECTION=section-name, LAYOUT=ON, [MERGE=ON|OFF,]
 [UNITS=IN|CM|PTS,] [PAGESIZE=size,] [ORIENTATION=PORTRAIT|LANDSCAPE,]
 [LEFTMARGIN=m,] [RIGHTMARGIN=m,] [TOPMARGIN=m,] [BOTTOMMARGIN=m,] $
where:
- section-name
-
Is the unique identifier of the section, up to 16 characters.
- LAYOUT=ON
-
Specifies that the section uses a complex layout.
Note: LAYOUT=ON is the only applicable option at this time.
- MERGE={ON|OFF}
-
Specifies whether the section is coordinated (merged) based on the value of the initial BY field.
Note: The default value is OFF.
- m
-
Specifies the margins (LEFT, RIGHT, TOP, BOTTOM) in inches, centimeters, or points.
If the optional items, UNITS, PAGESIZE, ORIENTATION, or MARGIN are present in the SECTION declaration, they override any settings of these parameters within the component reports, global SET commands, ON TABLE SET commands, and StyleSheet keywords.
Reference: PAGELAYOUT Declaration
A SECTION consists of one or more PAGELAYOUT declarations, each of which group together a number of COMPONENT declarations that are laid out on that particular page of the section.
The PAGELAYOUT keyword brackets a group of COMPONENT declarations that follow, up to the next PAGELAYOUT keyword, or the end of the section.
The PAGELAYOUT syntax appears as:
PAGELAYOUT={n|ALL},
 [TOPMARGIN=m,] [BOTTOMMARGIN=m,]$
where:
- {n|ALL}
-
Specifies on what page of a multi-page layout the components appear. The value (n) is either a page number within the current section, or ALL to indicate that the component appears on every page of the section.
- The PAGELAYOUT
values are numbered starting with 1. For example, if a compound
report is printed on two sides of a page, the component reports
on the front side would be specified as PAGELAYOUT 1,
and the reverse side would be PAGELAYOUT 2.
Note: Syntax is required even if the report only contains a single page.
PAGELAYOUT=1, $
- The PAGELAYOUT=ALL
syntax specifies a component that appears on every page. This is
useful for components that generate page headers or footers.
PAGELAYOUT=ALL, $
- The PAGELAYOUT
values are numbered starting with 1. For example, if a compound
report is printed on two sides of a page, the component reports
on the front side would be specified as PAGELAYOUT 1,
and the reverse side would be PAGELAYOUT 2.
- m
-
Defines the boundaries (TOP, BOTTOM) for flowing reports in current units. For a description of flowing reports, see COMPONENT Declaration.
Reference: Page Masters
Components included in a declaration for PAGELAYOUT=ALL appear on every page of the report output. This is useful for creating a design theme for the compound report output:
- Page masters must
have a default report component (since COMPONENT is a required syntax
element), but that report component should not display any data, except
in the heading. If the component displays data or graphics in the
heading, you must leave space for the heading on every page, being
careful to place the other components in areas on the page that
do not overlap with the heading.
For example, the following report does not display any data:
SET COMPONENT='DfltCmpt1'
TABLE FILE SYSCOLUM
SUM TBNAME NOPRINT
IF READLIMIT EQ 1
ON TABLE SET PREVIEW ON
ON TABLE SET PAGE-NUM NOLEAD
END
- Page masters for
coordinated compound reports must have the same primary BY field
as other components in the compound layout report. The best way
to create the default component for the page master in a coordinated
compound report is to use one of the data sources for one of the
compound layout reports. For example, if a component report for
PAGELAYOUT1 is against the GGSALES data source, and the primary
BY field is PCD, the default component for the page master could
be:
SET COMPONENT='DfltCmpt1'
TABLE FILE GGSALES
SUM UNITS NOPRINT
BY PCD NOPRINT
IF READLIMIT EQ 1
ON TABLE SET PREVIEW ON
ON TABLE SET PAGE-NUM NOLEAD
END
Note that the recommended way to create a design theme with repeating text and images on a page master is to place drawing objects on the page master. For information, see Draw Objects With Document Syntax.
- Page master styling for size and orientation only applies to the default document level. Page master elements do not automatically resize and position for various page orientations throughout the document. For documents requiring mixed page orientations, each page layout can be defined with its own orientation. In this scenario, styling elements should be applied to the individual page layouts so that the styling can be appropriately applied for each change in page orientation.
Reference: COMPONENT Declaration
The order of COMPONENT declarations in the COMPOUND LAYOUT block must match the order in which the component reports are executed, and there must be a COMPONENT declaration for each component report.
There are two types of components: fixed and flowing. A fixed component fills the container defined by the dimension parameters on the page and, if additional data exists, it overflows onto the next page in the same fixed size in the same location. The size and location of the fixed overflow component can be customized on the overflow page (using the OVERFLOW-POSITION and OVERFLOW-DIMENSION parameters). In a flowing component, the data flows from the top of the defined component to the bottom page margin and then begins to flow again on the top page margin of the overflow page, until the data is complete. The starting position of each type of component is defined by the POSITION parameter.
You can also specify the starting position of a component relative to another component, using the RELATIVE-TO, RELATIVE-POINT, and POSITION-POINT keywords. In this case, the relative coordinates of the component's POSITION are interpreted based on where the component, to which it is relative, ends. If the relative component is a flowing component, you can optionally use the REQUIRED-SPACE keyword in conjunction with the RELATIVE-TO keyword to specify where to start the current component.
The fixed or flowing aspect of the component is determined by the DIMENSION parameter. For a fixed component, the DIMENSION parameter specifies sizes for the dimensions of the bounding box. However, for a flowing component the DIMENSION parameter specifies asterisks (* *) for the dimensions.
The COMPONENT syntax appears as:
COMPONENT=component-name, TYPE=component-type,
    POSITION=(x y), DIMENSION=(xsize ysize),
    [OVERFLOW-POSITION=(x y),] [OVERFLOW-DIMENSION=(xsize ysize),]
    [RELATIVE-TO=relative_component_name,]
    [RELATIVE-POINT=relative-value, POSITION-POINT=position-value,
      REQUIRED-SPACE=required-space-value,]
    [DRILLMAP=((L1 targetreport)),]  $
where:
- component-name
-
The name of the component must be a unique identifier, up to 16 characters. It designates a component report that appears later in the request (in the same procedure (FOCEXEC) or in a called procedure), and is identified by SET COMPONENT=component-name syntax, using the same name.
Note: The SET syntax only tags styled reports that can participate in a compound report, so it can be placed before unstyled reports that precede the report to be named. For example, reports that generate extract files.
- component-type
-
Specifies the type of component being declared. Currently, only REPORT is supported.
- POSITION=(x y)
-
Specifies the (x y) coordinate on the page where the upper-left corner of the component is to be placed. All coordinates are in current UNITs (default inches), and (0 0) is the upper-left corner of the physical page.
Note: By default, coordinates are absolute locations on the physical page. If x or y is preceded by a plus sign (+) or a minus sign ( - ), for example, (+.25 +0), the coordinate is relative to the top-left page margin. If the RELATIVE-TO keyword is present, then a relative coordinate is relative to the named object of RELATIVE-TO declared in the keyword.
- DIMENSION=(xsize ysize)
-
Specifies the size of the bounding box of the component (in current UNITs).
For a fixed component, xsize and ysize must be numeric dimension sizes.
For a flowing component, xsize and ysize must both be asterisks DIMENSION = (* *).
- OVERFLOW-POSITION=(x y) and OVERFLOW-DIMENSION=(xsize ysize)
-
These optional items specify the position and dimension on subsequent pages, if it overflows its initial bounding box.
OVERFLOW-POSITION and OVERFLOW-DIMENSION are supported for flowing components, as well. For example:
COMPONENT='report2', TEXT='report2', TOC-LEVEL=2,
POSITION=(0.5 1.7), DIMENSION=(* *), OVERFLOW-POSITION=(0.5 1.7), OVERFLOW-DIMENSION=(* *),
- RELATIVE-TO=relative_component_name
-
Specifies another component with respect to which relative coordinates of the current component's POSITION are interpreted.
The relative component must either have a fixed position, or be generated prior to the current component.
- RELATIVE-POINT=relative-value and POSITION-POINT=position-value
-
These optional parameters designate which point on the current component is positioned relative to which point on the relative component (for example, TOP-LEFT of the current component relative to BOTTOM-LEFT of the relative component).
Can be set to any combination of the following values:
- TOP-LEFT
- TOP-CENTER
- TOP-RIGHT
- CENTER-LEFT
- CENTER
- CENTER-RIGHT
- BOTTOM-LEFT
- BOTTOM-CENTER
- BOTTOM-RIGHT
- REQUIRED-SPACE=required-space-value
-
Specifies the minimum amount of space that must be left on the page, from where the relative component ends, in order to start the current component. If there is not enough space left from where the relative component ends, the current component will start on the next page.
Can be one of the following:
- An (x y) pair that specifies, in current units, the minimum horizontal and vertical space left on the page after the relative component and that is needed in order to start the current component.
- AUTO, which will automatically calculate the remaining available space left on the page after the relative component and determine if the entire current component can fit into that space. If it cannot fit in the available space, it will start the current component on the next page.
- DRILLMAP=((L1 targetreport))
-
Identifies the link identifier and the target report for a Drill Through hyperlink from this report. L1 is a sufficient link identifier at this time. For more information on Drill Through reports, see How to Creating a Drill Through PDF Compound Report.
Note: The double parentheses are required.
Example: Creating a Compound Layout Report With Document Syntax
In this simple example using the GGSALES Master File, the MERGE keyword specifies that a Coordinated Compound Layout Report is to be generated. Since the first BY field of each component is REGION, a page will be generated for each value of REGION, with the first report (Sales) positioned at (1 1) and the second report (Units) at (6.25 1).
Enter the following syntax in the Text Editor.
SET PAGE-NUM=OFF
COMPOUND LAYOUT PCHOLD FORMAT PDF
SECTION=S1, LAYOUT=ON, MERGE=ON, ORIENTATION=LANDSCAPE, $
PAGELAYOUT=1, $
COMPONENT=Sales, TYPE=REPORT, POSITION=(1 1), DIMENSION=(4 4), $
COMPONENT=Units, TYPE=REPORT, POSITION=(6.25 1), DIMENSION=(4 4), $
END
SET COMPONENT=Sales
TABLE FILE GGSALES
"Sales report for <REGION"
" "
SUM DOLLARS/F8M
BY REGION NOPRINT
BY ST
BY CITY
ON TABLE HOLD FORMAT PDF
ON TABLE SET STYLE *
TYPE=REPORT, FONT=HELVETICA, COLOR=RED, SQUEEZE=ON, $
END
SET COMPONENT=Units
TABLE FILE GGSALES
"Number of unit sales per product for <REGION"
" "
SUM CNT.UNITS AS 'Number of units sold'
BY REGION NOPRINT
BY PRODUCT
ON TABLE HOLD FORMAT PDF
ON TABLE SET STYLE *
TYPE=REPORT, FONT=HELVETICA, COLOR=BLUE, SQUEEZE=ON, $
ENDSTYLE
END
COMPOUND END
The following syntax is an example of what the same report might look like if the component reports were in pre-existing procedures (FOCEXECs), as indicated by R1 and R2.
SET PAGE-NUM=OFF
SET SQUEEZE=ON
COMPOUND LAYOUT PCHOLD FORMAT PDF
SECTION=S1, LAYOUT=ON, MERGE=ON, ORIENTATION=LANDSCAPE, $
PAGELAYOUT=1, $
COMPONENT=R1, TYPE=REPORT, POSITION=(1 1), DIMENSION=(4 4), $
COMPONENT=R2, TYPE=REPORT, POSITION=(6 1), DIMENSION=(4 4), $
END
SET COMPONENT=R1
EX REPORT1
SET COMPONENT=R2
EX REPORT2
COMPOUND END
The first page of output is:
Example: Creating a Coordinated Graph With Document Syntax
This example, using the GGSALES Master File, generates a Coordinated Compound Layout report that contains a graph and a report (by replacing the first report in the previous example with a graph). Note that a graph request with two BY fields will generate a graph for each value of the first BY field (REGION), and that these files are named by appending sequence numbers to the HOLD file name. For example, HOLD0.SVG, HOLD1.SVG, and so on.
To place these graphs into a report as a component of a Coordinated Compound Layout report, several COMPUTE commands are required to construct the name of each graph file (HOLD0.SVG, HOLD1.SVG, and so on). Additionally, a COMPUTE command will add the image files into the HEADING of the TABLE request so that they are associated with the same value of REGION, from which they were originally produced.
Enter the following syntax in the Text Editor.
SET PAGE-NUM=OFF
COMPOUND LAYOUT PCHOLD FORMAT PDF
SECTION=S1, LAYOUT=ON, MERGE=ON, ORIENTATION=LANDSCAPE, $
PAGELAYOUT=1, $
COMPONENT=Sales, TYPE=REPORT, POSITION=(0.25 1), DIMENSION=(4 4), $
COMPONENT=Fuel, TYPE=REPORT, POSITION=(7.25 1), DIMENSION=(4 4), $
END
SET COMPONENT=Sales
GRAPH FILE GGSALES
SUM PCT.DOLLARS
BY REGION NOPRINT
BY PRODUCT
ON GRAPH SET LOOKGRAPH HBAR
ON GRAPH HOLD AS HOLD FORMAT SVG
ON GRAPH SET GRAPHSTYLE *
setPlace(true);
setColorMode(1);
setDepthRadius(0);
setDepthAngle(0);
setDisplay(getO1MajorGrid(),false);
setTransparentBorderColor(getFrame(),true);
setDisplay(getDataText(),true);
setTextFormatPreset(getDataText(),28);
setFontSizeAbsolute(getDataText(),true);
setFontSizeInPoints(getDataText(),9);
setPlaceResize(getDataText(),0);
setFontStyle(getDataText(),0);
setTransparentBorderColor(getSeries(0),true);
setDisplay(getO1AxisLine(),false);
setFontSizeAbsolute(getO1Label(),true);
setFontSizeInPoints(getO1Label(),9);
setPlaceResize(getO1Label(),0);
setFontSizeAbsolute(getY1Label(),true);
setFontSizeInPoints(getY1Label(),9);
setPlaceResize(getY1Label(),0);
setTextFormatPreset(getY1Label(),28);
setGridStyle(getY1MajorGrid(),3);
setDisplay(getY1AxisLine(),false);
setDisplay(getY1MajorGrid(),false);
setDisplay(getY1Label(),false);
setDataTextPosition(3);
setTextString(getO1Title(),"");
setTextString(getY1Title(),"");
setFontStyle(getTitle(),0);
ENDSTYLE
END
TABLE FILE GGSALES
"Percent of Sales by Product in <REGION"
" "
SUM
COMPUTE CNTR/I4 = CNTR + 1; NOPRINT
COMPUTE CNTR2/A4 = IF &FOCGRAPHCNT EQ 1 THEN ' ' ELSE FTOA(CNTR-1,'(F4)','A4'); NOPRINT
COMPUTE IMG/A16 = 'HOLD'||LJUST(4,CNTR2,'A4')|| '.svg'; NOPRINT
BY REGION NOPRINT
ON REGION PAGE-BREAK
ON TABLE HOLD FORMAT PDF
ON TABLE SET STYLE *
type=HEADING, IMAGE=(IMG), position=(0 0), $
TYPE=REPORT,PAGE-LOCATION=OFF,$
TYPE=REPORT, FONT=HELVETICA, COLOR=BLACK, SQUEEZE=ON, $
ENDSTYLE
END
SET COMPONENT=Fuel
TABLE FILE GGSALES
"Sales report for <REGION"
" "
SUM DOLLARS/F8M
BY REGION NOPRINT
BY ST
BY CITY
ON TABLE HOLD FORMAT PDF
ON TABLE SET STYLE *
TYPE=REPORT, FONT=HELVETICA, COLOR=RED, SQUEEZE=ON, $
ENDSTYLE
END
COMPOUND END
The first page of output is:
Example: Creating Multi-Page Layouts With Document Syntax
In this example using the GGSALES Master File, multi-page layouts allow components to be placed in fixed locations on multiple pages. For example, a Coordinated Compound Layout report can contain component reports R1 and R2 for each value of the first sort field on the odd-numbered pages (front side), and R3 on the even-numbered pages (reverse side). Additionally, you can place the same heading that contains a logo and some text with the embedded value of the first sort field at the top of each side.
For the heading report, create a procedure (named HEADER.FEX), and enter the following syntax:
TABLE FILE GGSALES
" "
"Report package for <REGION"
BY REGION NOPRINT
ON TABLE HOLD FORMAT PDF
ON TABLE SET STYLE *
TYPE=REPORT, FONT=HELVETICA, SIZE=20, $
TYPE=REPORT, IMAGE=poweredbyibi.gif, POSITION=(+.25 +.25), $
TYPE=HEADING, LINE=2, ITEM=1, POSITION=4, $
ENDSTYLE
END
We will use components R1 and R2 from the previous example. If you did not already do so, save them as REPORT1.FEX and REPORT2.FEX. Enter the following syntax as the R3 report component, by creating a procedure named REPORT3.FEX.
TABLE FILE GGSALES
"Report R3 for <REGION"
BY REGION NOPRINT
SUM DOLLARS BY ST
ON TABLE HOLD FORMAT PDF
ON TABLE SET STYLE *
TYPE=REPORT, FONT=HELVETICA, COLOR=GREEN, $
ENDSTYLE
END
From the Text Editor, enter the following syntax specifying that the R1 and R2 report components appear on page 1. The R3 report component appears on page 2, and the heading report will appear on all pages of the document.
SET PAGE-NUM=OFF
SET SQUEEZE=ON
COMPOUND LAYOUT PCHOLD FORMAT PDF
SECTION=S1, LAYOUT=ON, MERGE=ON, ORIENTATION=LANDSCAPE, $
PAGELAYOUT=ALL, $
COMPONENT=HEADER, TYPE=REPORT, POSITION=(1 1), DIMENSION=(4 4), $
PAGELAYOUT=1, $
COMPONENT=R1, TYPE=REPORT, POSITION=(1 3), DIMENSION=(4 4), $
COMPONENT=R2, TYPE=REPORT, POSITION=(6 3), DIMENSION=(4 4), $
PAGELAYOUT=2, $
COMPONENT=R3, TYPE=REPORT, POSITION=(4 3), DIMENSION=(4 4), $
END
SET COMPONENT=HEADER
EX HEADER
SET COMPONENT=R1
EX REPORT1
SET COMPONENT=R2
EX REPORT2
SET COMPONENT=R3
EX REPORT3
COMPOUND END
Page 1 of the output is:
Page 2 of the output is:
Example: Creating Page Overflow With Document Syntax
A common type of report contains a fixed layout at the top of the page, followed by a report containing detail records of unfixed length. For example, a brokerage statement may contain the customer name and address, an asset-allocation graph, and a comparison of the portfolio with market indexes at the top, followed by a list of securities held in the account. If the list of securities overflows the first page, we would like it to continue on the second page, underneath the common heading which appears on all pages (a logo, account number, page number for instance). The OVERFLOW-POSITION and OVERFLOW-DIMENSION syntax enables us to specify where on the overflow page the report continues and what its maximum length on each overflow page should be. (Note that its width should not vary from one page to the next.)
The following example, using the GGSales Master File, demonstrates how you can use OVERFLOW-POSITION and OVERFLOW-DIMENSION to reposition the second report component (R2) so that it begins below the first component on the initial page, and two inches below the top of the page on subsequent pages. Note that this leaves enough space for the header report component (HEADER) at the top of each page.
Additionally, PAGELAYOUT=ALL forces the HEADER component to appear at the top of each overflow page.
Enter the following syntax in the Text Editor.
SET PAGE-NUM=OFF
COMPOUND LAYOUT PCHOLD FORMAT PDF
SECTION=Example, LAYOUT=ON, MERGE=OFF, $
PAGELAYOUT=1, $
COMPONENT=R1, TYPE=REPORT, POSITION=(1.5 2), DIMENSION=(8 3), $
COMPONENT=R2, TYPE=REPORT, POSITION=(.5 5), DIMENSION=(8 5),
OVERFLOW-POSITION=(.5 2), OVERFLOW-DIMENSION=(8 8.5), $
PAGELAYOUT=ALL, $
COMPONENT=HEADER, TYPE=REPORT, POSITION=(1.25 1), DIMENSION=(6 1), $
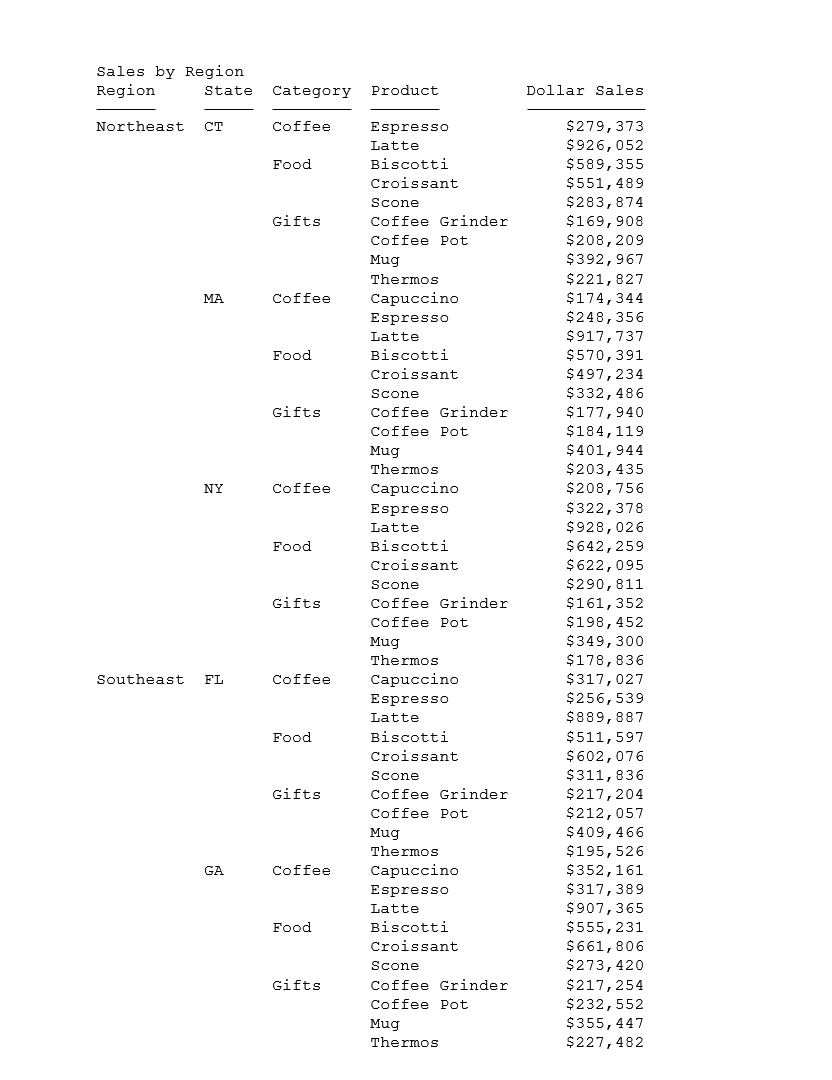
ENDSET COMPONENT=R1 TABLE FILE GGSALES HEADING CENTER "Report 1" "Sales Summary by Category" " " SUM UNITS BUDUNITS DOLLARS BUDDOLLARS BY CATEGORY ON TABLE HOLD FORMAT PDF ON TABLE SET STYLE * TYPE=REPORT, FONT=HELVETICA, SQUEEZE=ON, $ ENDSTYLE END
SET COMPONENT=R2
TABLE FILE GGSALES
HEADING CENTER
"Report 2"
"Sales Detail Report"
" "
SUM UNITS BUDUNITS DOLLARS BUDDOLLARS
BY CATEGORY BY PRODUCT BY REGION
ON CATEGORY UNDER-LINE
ON PRODUCT SUB-TOTAL
ON TABLE HOLD FORMAT PDF
ON TABLE SET STYLE *
TYPE=REPORT, FONT=HELVETICA, SQUEEZE=ON, $
ENDSTYLE
END
SET COMPONENT=HEADER
TABLE FILE GGSALES
HEADING
"Gotham Grinds sales to Information Builders, October 1997"
BY CATEGORY NOPRINT
ON TABLE HOLD FORMAT PDF
ON TABLE SET STYLE *
TYPE=REPORT, IMAGE=gotham.gif, POSITION=(3.25 .25), DIMENSION=(2 .75), $
ENDSTYLE
END
The first page of output is:
The second page of output is:
Syntax: How to Draw Objects With Document Syntax
A variety of objects can be drawn on the page to enhance a report. The currently supported objects include Lines, Boxes, Static text strings, and Images.
The syntax for drawing these objects may appear in the StyleSheet of a report, but they may also be included within a PAGELAYOUT grouping in the COMPOUND LAYOUT declarations. The syntax for each drawing object is described below.
- Lines. To
draw a line from point (x1 y1) to point (x2 y2), enter the following
syntax:
OBJECT=LINE, POSITION=(x1 y1), ENDPOINT=(x2 y2),
        [BORDER=b,] [BORDER-COLOR=c,] [BORDER-STYLE=s,]$
Optionally, the border attributes BORDER, BORDER-COLOR, and BORDER-STYLE follow the existing BORDER syntax, as shown below:
OBJECT=LINE, POSITION=(1 1), ENDPOINT=(8 1), BORDER=HEAVY, BORDER-COLOR=RED, BORDER-STYLE=DASHED, $ - Boxes. To
draw a box, whose upper left corner is at (x y), and whose dimensions
are xdim by ydim, enter the following syntax:
OBJECT=BOX, POSITION=(x y), DIMENSION=(xdim ydim),
        BACKCOLOR=c,
        [BORDER=b,] [BORDER-COLOR=bc,] [BORDER-STYLE=bs,] $
Tip: The background color, which is c, specifies the color with which the box is filled and can be any valid color. For example, yellow or RGB(200 200 200).
As in the BORDER syntax, the individual sides of the box can be styled separately. For example:
OBJECT=BOX, POSITION=(1 1), DIMENSION=(2 3),
        BACKCOLOR=YELLOW,
        BORDER=HEAVY, BORDER-TOP-COLOR=RED, BORDER-BOTTOM-COLOR=BLUE, $
Note that, as in the BORDER syntax, attributes of lines or boxes that are not explicitly specified have the following defaults:
- Color: black
- Style: solid
- Width border attribute: medium
- Static text strings. Static
text strings display text that you enter as part of the object description.
You can format the text displayed in the text object by including markup tags within the text portion of the text object. A report with markup tags in a text object is called a markup report. A markup report can be generated as a PDF, DHTML, PPT, or PPTX output file. WebFOCUS supports a subset of HTML tags and its own page numbering tags. To activate these markup tags (so that they are treated as formatting elements instead of displaying as text), add the attribute MARKUP=ON to the string object. For additional information, see Text Formatting Markup Tags for a Text Object.
To draw a static text string at position (x y), enter the following syntax:
OBJECT=STRING, POSITION=(X Y), TEXT='any text you like', [MARKUP={ON|OFF},] [FONT=f,] [SIZE=sz,] [STYLE=st,] [COLOR=c,]
        [WRAP=ON, DIMENSION=(xdim ydim),] [LINESPACING=linesoption ,]
 $
where:
- POSITION=(xy)
-
Specifies the (x y) coordinate on the page where the upper-left corner of the component is to be placed. All coordinates are in current UNITs (default is inches), and (0 0) is the upper-left corner of the physical page.
Note: By default, coordinates are absolute locations on the physical page. If x or y is preceded by a plus sign (+) or minus sign ( - ), for example, (+.25 +0), the coordinate is relative to the left or top page margin.
- TEXT='any text you like'
-
Is the text to be placed in the text object.
Note: If your text contains any open caret characters (<), you must put a blank space after each open caret that is part of the text. If you do not, everything following the open caret will be interpreted as the start of a markup tag and will not display as text.
- MARKUP={ON|OFF}
-
ON causes the markup tags to be interpreted as formatting options. OFF displays the tags as text. OFF is the default value.
- FONT=f
- Is the default font to be used for the text.
- SIZE=sz
-
Is the default font size to be used for the text.
- STYLE=st
-
Is the default font style to be used for the text.
- COLOR=c
-
Is the default font color to be used for the text.
- WRAP=ON
-
Specifies that the text should wrap when it reaches the end of the text object bounding box.
- DIMENSION=(xdimydim)
-
Specifies the size of the text object bounding box (in current UNITs).
- LINESPACING=linesoption
-
Determines the amount of vertical space between lines of text in a paragraph. Two types of LINESPACING attributes are supported:
LINESPACING={SINGLE|1.5LINES|DOUBLE}or
LINESPACING=type(value)
where:
- SINGLE
-
Accommodates the largest font in that line, plus a small amount of extra space. The amount of extra space varies depending on the font used. SINGLE is the default option.
- 1.5LINES
-
Is one-and-one-half times that of single line spacing.
- DOUBLE
-
Is twice that of single line spacing.
- type(value)
-
Can be one of the following where value is a positive number:
Type
Value
Example
MULTIPLE
The percentage by which to increase or decrease the line space.
LINESPACING=MULTIPLE(1.2) increases line space by 20 percent.
MIN
The minimum line space (in the unit specified by UNITS parameter) needed to fit the largest font on the line.
LINESPACING=MIN(0.5) provides a minimum line space of 0.5 inch when UNITS=IN.
EXACT
The fixed line space (in the unit specified by UNITS parameter) that WebFOCUS does not adjust.
LINESPACING=EXACT(.3) provides a fixed line space of 0.3 inch when UNITS=IN.
Optionally, you may specify the FONT, SIZE, STYLE, and COLOR attributes as you would for any textual object in a report. For example:
OBJECT=STRING, POSITION=(1 1), TEXT='Hello world!',
        FONT=TIMES, SIZE=12, STYLE=BOLD, COLOR=RED, $
Note: A position of a string is measured from its bottom left to allow strings with different heights to be aligned to a common base-line. However, if WRAP=ON is present, it indicates that the string should be wrapped to a bounding box whose top-left corner is at (x y) and whose dimensions are (xdim ydim). In this case, the top left of the text string is positioned at point (x y).
- Images. An
image can be drawn as a drawing object by entering the following
syntax:
OBJECT=IMAGE, IMAGE=file, POSITION=(x y), DIMENSION=(xdim ydim), $
Note: The image file name=file can be any image file valid in a PDF report. POSITION is used as with a conventional image, and DIMENSION is used in place of the SIZE attribute of a conventional image.
Example: Drawing Objects With Document syntax
The following example shows how drawing objects can be placed inside the COMPOUND LAYOUT syntax using the GGSALES Master File. Note that a drawing object, like a COMPONENT, appears on the page whose PAGELAYOUT declaration it follows.
SET PAGE-NUM=OFF
SET SQUEEZE=ON
COMPOUND LAYOUT PCHOLD FORMAT PDF
SECTION=S1, LAYOUT=ON, MERGE=ON, ORIENTATION=LANDSCAPE, $
PAGELAYOUT=1, $
COMPONENT=Sales, TYPE=REPORT, POSITION=(1 1), DIMENSION=(4 4), $
COMPONENT=Budget, TYPE=REPORT, POSITION=(6.25 1), DIMENSION=(4 4), $
OBJECT=IMAGE, IMAGE=gglogo.gif, POSITION=(1 4.5), DIMENSION=(1 1), $
OBJECT=BOX, POSITION=(1 1), DIMENSION=(5 3), BACKCOLOR=GOLDENROD, $
END
SET COMPONENT=Sales
TABLE FILE GGSALES
"Sales report for <REGION"
" "
SUM DOLLARS
BY REGION NOPRINT
BY CATEGORY
ON TABLE HOLD FORMAT PDF
ON TABLE SET STYLE *
TYPE=REPORT, FONT=HELVETICA, STYLE=BOLD, $
ENDSTYLE
END
SET COMPONENT=Budget
TABLE FILE GGSALES
"Budget report for <REGION"
" "
SUM BUDDOLLARS
BY REGION NOPRINT
BY CATEGORY
ON TABLE HOLD FORMAT PDF
ON TABLE SET STYLE *
TYPE=REPORT, FONT=HELVETICA, COLOR=BLUE, $
ENDSTYLE
END
COMPOUND END
The first page of output is:
Note: A drawing object will not be drawn unless there is at least one COMPONENT in its PAGELAYOUT.
Syntax: How to Display Grids With Document Syntax
The SET LAYOUTGRID command can be used as an aid to manually develop report layouts. Displaying grids superimposes a light one-inch by one-inch grid on the page so that the locations of the various report components can be verified. Currently, the grid only works in inches.
Enter the following syntax to display grids:
SET LAYOUTGRID=ON
Reference: Text Formatting Markup Tags for a Text Object
Note: If your text contains any open caret characters (<), you must put a blank space after each open caret that is part of the text. If you do not, everything following the open caret will be interpreted as the start of a markup tag and will not display as text.
Font Properties
The font tag supports three attributes: face, size, and color (where the color must be specified as the hexadecimal number code for the color):
<font face="font" size=[+|-]n color=color_code>text</font>
For example:
<font face="New Century Schoolbook">Test1</font>
<font face="Times" size=12>test2</font>
<font face="Times New Roman" color=#0000FF size=+4>Test3</font>
<font size=-2 face="Times New Roman" color=#0000FF >Test4</font>
Text Styles
The supported text styles are bold, italic, underline, and superscript:
Bold: <b>text</b>
Italic: <i>text</i>
Underline: <u>text</u>
Superscript: <sup>text</sup>
Line Breaks
The line break tag after a portion of text begins the next portion of text on a new line. Note that there is no closing tag for a line break:
<br>
Text Alignment
The alignment options pertain to wrapped text, as well as specified line breaks. Both horizontal justification and vertical alignment are supported.
- Horizontal Justification
Left Justification:
<left>text</left>
Right Justification:
<right>text</right>
Center Justification:
<center>text</center>
Full Justification:
<full>text</full>
- Vertical Alignment
Top Alignment:
<top>text</top>
Middle Alignment:
<mid>text</mid>
Bottom Alignment:
<bottom>text</bottom>
Unordered (Bullet) List
The unordered (ul) list tag encloses a bullet list. Each item is enclosed in a list item tag (li). The start tag and end tag for the list must each be on its own line. Each list item must start on a new line:
<ul>
<li>list item1</li>
<li>list item2</li>
  .
  .
  .
</ul>
By default, the bullet type is disc. You can also specify circle or square:
<ul type=disc>
<ul type=circle>
<ul type=square>
Ordered (Number or Letter) List
The ordered (ol) list tag encloses a list in which each item has a consecutive number or letter. Each item is enclosed in a list item tag (li). The start tag and end tag for the list must each be on its own line. Each list item must start on a new line:
<ol>
<li>list item1</li>
<li>list item2</li>
  .
  .
  .
</ol>
By default, Arabic numerals (type=1) are used for the ordering of the list. You can specify the following types of order:
Arabic numerals (the default): <ol type=1>
Lowercase letters: <ol type=a>
Uppercase letters: <ol type=A>
Lowercase Roman numerals: <ol type=I>
Uppercase Roman numerals: <ol type=I>
Hyperlinks
Hyperlinks can be included within text markup in PDF documents.
The syntax for the anchor markup tag is a subset of the HTML anchor syntax:
<a href="hyperlink">Text to display</a>
where:
- hyperlink
-
Is the hyperlink to jump to when the text is clicked.
- Text to display
-
Is the text to display for the hyperlink.
For example:
<a href="http://www.example.com/help.htm">Click here for help</a>
No other attributes are supported in the anchor markup tag.
Page Numbering and Dates
There are two pseudo-HTML tags for embedding page numbers in text on a Page Master for a Coordinated Compound Layout report:
Current page number: <ibi-page-number/>
Total number of pages: <ibi-total-pages/>
Note that when MARKUP=ON, space is allocated for the largest number of pages, so there may be a wide gap between the page number and the text that follows. To remove the extra space in the text object that has the page numbering tags:
-
If specific styling of the text object is not required, do not insert markup tags, and turn MARKUP=OFF.
MARKUP=OFF, TEXT='Page <ibi-page-number/> of <ibi-total-pages/> of Sales Report', $
This displays the following
Page 1 of 100 of Sales Report
-
If specific styling of the text object is required, you must set MARKUP=ON. With MARKUP=ON, set WRAP=OFF and do not place any styling tags between the page number variables within the string. Tags can be used around the complete Page n of m string. The following code produces a page number string without the extra spaces:
MARKUP=ON, WRAP=OFF, TEXT='<font face="ARIAL" size=10><i>Page <ibi-page-number/> of <ibi-total-pages/> of Sales Report </i>', $
This displays the following

To display a date in the report output, insert a WebFOCUS date variable in a text object on a Page Master (such as &DATEtrMDYY) in the text object.
Example: Formatting a Compound Layout Text Object With Markup Tags
The following request displays a text object with markup tags in a PDF output file.
Note: Text markup syntax cannot contain hidden carriage return or line feed characters. For purposes of presenting the example in this documentation, line feed characters have been added so that the sample code wraps to fit within the printed page. To run this example in your environment, copy the code into a text editor and delete any line feed characters within the text markup object by going to the end of each line and pressing Delete. In some instances, you may need to add a space to maintain the structure of the string. For additional information on displaying carriage returns within the text object see Text Formatting Markup Tags for a Text Object.
SET PAGE-NUM=OFF
SET LAYOUTGRID=ON
TABLE FILE GGSALES
BY REGION NOPRINT
ON TABLE PCHOLD AS LINESP1 FORMAT PDF
ON TABLE SET STYLE *
type=report, size=8, $
object=string, position=(1 1), dimension=(7 3), wrap=on, markup=on,
 linespacing=multiple(3),
 text='<b><font face="Arial" size=12>This paragraph is triple-spaced
 (LINESPACING=MULTIPLE(3)):</font></b>
 <full>Our <i>primary</I> goal for fiscal 2006 was to accelerate our
 transformation to customer centricity. In this letter, I’d like to
 give you an update on this work, which contributed to the 22-percent
 increase in earnings from continuing operations we garnered for fiscal
 2006. Since the past is often prologue to the future, I’d like to
 describe how customer centricity is influencing not only our goals for
 fiscal 2007, but also our long-term plans. At Gotham Grinds, customer
 centricity means treating each customer as a unique individual, meeting
 their needs with end-to-end solutions, and engaging and energizing our
 employees to serve them.</full>', $
ENDSTYLE
END
In this request:
- No fields from the data source are displayed. Only the text object displays on the output.
- The SET LAYOUTGRID command displays a grid to indicate the coordinates and dimensions of the text object.
- The OBJECT=STRING declaration specifies triple spacing: LINESPACING=MULTIPLE(3).
- The following
text is displayed in boldface, in the Arial font face, and with
a font size of 12 (the default is 8 from the TYPE=REPORT declaration):
‘This paragraph is triple-spaced (LINESPACING=MULTIPLE(3)):’
The markup for this formatting is:
<b><font face="Arial" size=12>This paragraph is triple-spaced (LINESPACING=MULTIPLE(3)):</font></b>
Note, however, that the image has been resized to fit the page so the font may appear smaller:
- The remainder
of the text is displayed with full justification (left and right
sides align):
<full>Our ... </full>
- The following
markup displays the text ‘primary’ in italics:
<i>primary</I>
The output is:
Example: Drawing Text and Line objects on a Page Master
The following request places a line on the page master between the header report and the component reports and places a line and a text string on the bottom of each page:
SET PAGE-NUM=OFF
SET SQUEEZE=ON
COMPOUND LAYOUT PCHOLD FORMAT PDF
SECTION=S1, LAYOUT=ON, MERGE=ON, ORIENTATION=LANDSCAPE, $
PAGELAYOUT=ALL, $
COMPONENT=HEADER, TYPE=REPORT, POSITION=(1 1), DIMENSION=(4 4), $
OBJECT=STRING, POSITION=(1 6.6), MARKUP=ON,
TEXT='<font face="Arial" color=#0000FF size=12> Page <ibi-page-number/>
        </font> ', WRAP=ON, DIMENSION=(4 4),$
OBJECT=LINE, POSITION=(1 2.5), ENDPOINT=(9.5 2.5),
        BORDER-COLOR=BLUE,$
OBJECT=LINE, POSITION=(1 6.5), ENDPOINT=(9.5 6.5),
        BORDER-COLOR=BLUE,$
PAGELAYOUT=1, $
COMPONENT=R1, TYPE=REPORT, POSITION=(1 3), DIMENSION=(4 4), $
COMPONENT=R2, TYPE=REPORT, POSITION=(6 3), DIMENSION=(4 4), $
PAGELAYOUT=2, $
COMPONENT=R3, TYPE=REPORT, POSITION=(4 3), DIMENSION=(4 4), $
END
SET COMPONENT=HEADER TABLE FILE GGSALES " " "Report package for <REGION" BY REGION NOPRINT ON TABLE HOLD FORMAT PDF ON TABLE SET STYLE * TYPE=REPORT, FONT=HELVETICA, SIZE=20, $ TYPE=REPORT, IMAGE=gglogo.gif, POSITION=(+.25 +.25), $ TYPE=HEADING, LINE=2, ITEM=1, POSITION=1.5, $ ENDSTYLE END SET COMPONENT=R1 TABLE FILE GGSALES "Sales report for <REGION" " " SUM DOLLARS/F8M BY REGION NOPRINT BY ST BY CITY ON TABLE SET STYLE * TYPE=REPORT, FONT=HELVETICA, COLOR=RED, SQUEEZE=ON, $ ENDSTYLE END SET COMPONENT=R2 TABLE FILE GGSALES "Number of unit sales per product for <REGION" " " SUM CNT.UNITS AS 'Number of units sold' BY REGION NOPRINT BY PRODUCT ON TABLE SET STYLE * TYPE=REPORT, FONT=HELVETICA, COLOR=BLUE, SQUEEZE=ON, $ ENDSTYLE END SET COMPONENT=R3 TABLE FILE GGSALES "Report R3 for <REGION" BY REGION NOPRINT SUM DOLLARS BY ST ON TABLE SET STYLE * TYPE=REPORT, FONT=HELVETICA, COLOR=GREEN, $ ENDSTYLE END COMPOUND END
The first page of output is:
The second page of output has the same drawing objects:
Example: Vertically Aligning Text Markup in PDF Report Output
The following request creates three boxes and places a text string object within each of them:
- In the left box, the text is aligned vertically at the top.
- In the middle box, the text is aligned vertically at the middle.
- In the right box, the text is aligned vertically at the bottom.
Note: Text markup syntax cannot contain hidden carriage return or line feed characters. For purposes of presenting the example in this documentation, line feed characters have been added so that the sample code wraps to fit within the printed page. To run this example in your environment, copy the code into a text editor and delete any line feed characters within the text markup object by going to the end of each line and pressing Delete. In some instances, you may need to add a space to maintain the structure of the string. For additional information on displaying carriage returns within the text object see Text Formatting Markup Tags for a Text Object.
SET PAGE-NUM=OFF
TABLE FILE GGSALES
BY REGION NOPRINT
ON TABLE PCHOLD FORMAT PDF
ON TABLE SET STYLE *
type=report, font=arial, size=10, $
object=box, position=(1 1), dimension=(6 1), $
object=line, position=(3 1), endpoint=(3 2), $
object=line, position=(5 1), endpoint=(5 2), $
object=string, text='<top>Vertically aligned text within a text object using top alignment.</top>', position=(1.05 1), dimension=(2 1), linespacing=exact(.15), markup=on, wrap=on, $
object=string, text='<mid>Vertically aligned text within a text object using middle alignment.</mid>', position=(3.05 1), dimension=(2 1), linespacing=exact(.15), markup=on, wrap=on, $
object=string, text='<bottom>Vertically aligned text within a text object using bottom alignment.</bottom>', position=(5.05 .9), dimension=(2 1),linespacing=exact(.15), markup=on, wrap=on, $
ENDSTYLE
END
The output is:
Reference: Coordinated Compound Layout Reports With Missing Data
A Coordinated Compound Layout report is comprised of individual component reports or graphs with a common first sort field. The compound procedure generates an output document with a separate page (or set of pages) for each individual value of the sort field, with the embedded components segmented to display the data that corresponds to that sort field value.
A Coordinated Compound Layout report page is generated in the designated page layout for every sort field value found in at least one of the component reports, presenting the appropriate data for those components where data exists for that value, and presenting an empty component report where data does not exist.
The way an empty component is represented on the report page is dependent on how the component positioning is defined within the Coordinated Compound Layout report. Components can be defined with absolute positioning or relative to other components in the layout. If the empty component and subsequent components on the page are defined with absolute positioning, the empty component report will display as blank space in the designated location. If relative positioning is defined between the empty component and subsequent components, the subsequent components will float up on the page, and no empty space will be displayed in the area defined for the empty component.
In compound reports with relative positioning defined between reports, when an empty report is encountered, the report following the empty report is positioned vertically relative to the bottom of the last non-empty report and horizontally relative to the page margin. This means that when a report contains no data, the subsequent report will float up (vertically) and begin relative to the previous report but it will not move horizontally on the page relative to either of the previous reports
Using POSITION = (X Y), the placement of a report is designated by the left coordinate (X = horizontal) and the top coordinate (Y = vertical). Each of these coordinates can be defined independently as relative to the previous report or in a fixed position on the page.
To define positioning so that the report floats up on the page to replace the empty report but is anchored in a fixed left position on the page, you can define the Y coordinate (top) as relative and anchor the X coordinate (left). To anchor one of the position coordinates, change the reference from a relative position (+/-) to an absolute position. For example:
Both coordinates relative: POSITION(+0.003 +0.621)
Anchor horizontal / flow vertical: POSITION( 0.520 +0.621)
You do not need to change or add any WebFOCUS syntax to your request in order to take advantage of this feature. You will, however, want to pay attention to how you select and relate the data within your coordinated components to ensure you are generating the desired output.
Example: Setup: Creating a Coordinated Compound Report With Missing Data
In this example, we will create a set of statements reporting the outstanding inventory orders for a select group of stores. Each store may have unfilled orders in any of three inventory categories: Food, Coffee, and Gifts.
To demonstrate how this works we will first build a set of data files: a header file containing contact information for the selected set of stores, and transaction files for each inventory category. We are selecting specific data to demonstrate how this will work when different component reports are empty.
After creating the data files, we will build four component reports, one to display the header information and one for each inventory category.
Finally, we will bring them together in a Coordinated Compound Layout report that merges all of this information into a single statement page for each store.
Example: Step 1: Creating the Data Files
The following four data files will be created from a join of the GGORDER and GGSALES data sources:
|
Data File Created |
Type of Information Included |
Stores included |
|---|---|---|
|
GGHDR |
Store information |
R1019, R1020, R1040, R1041 |
|
GG1 |
Order transactions for Coffee |
R1019, R1040, R1088 |
|
GG2 |
Order transactions for Food |
R1019, R1020, R1041, R1088 |
|
GG3 |
Order transactions for Gifts |
R1019, R1020, R1040, R1088 |
The APP HOLD, JOIN, and DEFINE commands are:
APP HOLD baseapp
JOIN
 GGORDER.ORDER01.STORE_CODE IN GGORDER TO
   UNIQUE GGSTORES.STORES01.STORE_CODE
   IN GGSTORES AS J1
END
DEFINE FILE GGORDER
PRODUCT_CATEGORY/A15=IF (PRODUCT_DESCRIPTION IN
                     ('Biscotti','Croissant','Scone')) THEN 'Food'
                     ELSE IF (PRODUCT_DESCRIPTION IN
                     ('French Roast','Hazelnut','Kona')) THEN 'Coffee' ELSE 'Gifts';
END
The following procedure creates the data source GGHDR:
TABLE FILE GGORDER
SUM
     FST.STORE_NAME
     FST.ADDRESS1
     FST.ADDRESS2
     FST.CITY
     FST.STATE
     FST.ZIP
BY STORE_CODE
WHERE STORE_CODE IN ('R1019','R1020','R1040','R1041');
ON TABLE NOTOTAL
ON TABLE HOLD AS GGHDR FORMAT FOCUS INDEX 'STORE_CODE'
END
The following procedure creates the data source GG1:
TABLE FILE GGORDER
PRINT
     QUANTITY
     UNIT_PRICE
     PACKAGE_TYPE
     SIZE
     VENDOR_NAME
     PRODUCT_CATEGORY
BY STORE_CODE
BY ORDER_DATE
BY PRODUCT_DESCRIPTION
WHERE ( PRODUCT_CATEGORY EQ 'Coffee' ) AND ( ORDER_DATE GE '09/01/97' );
WHERE STORE_CODE IN ('R1019','R1040','R1088');
ON TABLE HOLD AS GG1 FORMAT FOCUS INDEX 'STORE_CODE'
END
The following procedure creates the data source GG2:
TABLE FILE GGORDER
PRINT
     QUANTITY
     UNIT_PRICE
     PACKAGE_TYPE
     SIZE
     VENDOR_NAME
     PRODUCT_CATEGORY
BY STORE_CODE
BY ORDER_DATE
BY PRODUCT_DESCRIPTION
WHERE ( PRODUCT_CATEGORY EQ 'Food' ) AND ( ORDER_DATE GE '09/01/97' );
WHERE STORE_CODE IN ('R1019','R1020','R1041','R1088');
ON TABLE HOLD AS GG2 FORMAT FOCUS INDEX 'STORE_CODE'
END
The following procedure creates the data source GG3:
TABLE FILE GGORDER
PRINT
     QUANTITY
     UNIT_PRICE
     PACKAGE_TYPE
     SIZE
     VENDOR_NAME
     PRODUCT_CATEGORY
BY STORE_CODE
BY ORDER_DATE
BY PRODUCT_DESCRIPTION
WHERE ( PRODUCT_CATEGORY EQ 'Gifts' ) AND ( ORDER_DATE GE '09/01/97' );
WHERE STORE_CODE IN ('R1019','R1020','R1040','R1088');
ON TABLE HOLD AS GG3 FORMAT FOCUS INDEX 'STORE_CODE'
END
Example: Step 2: Creating the Component Reports
The following procedure, GGHDR.FEX, creates the first report component for the Coordinated Compound Layout report from the GGHDR data source. This will function as a header for each page of the Compound Layout report. The shared sort field for all of the report components is STORE_CODE. On each page of the PDF output file, this procedure lists the name and address of one store:
TABLE FILE GGHDR
BY STORE_CODE NOPRINT
HEADING
"<STORE_NAME "
"<ADDRESS1 "
"<ADDRESS2 "
"<CITY , <STATE   <ZIP "
" "
ON TABLE SET PAGE-NUM OFF
ON TABLE NOTOTAL
ON TABLE PCHOLD FORMAT HTML
ON TABLE SET HTMLCSS ON
ON TABLE SET STYLE *
     UNITS=IN,
     SQUEEZE=ON,
     ORIENTATION=PORTRAIT,$
TYPE=REPORT,
     GRID=OFF,
     FONT='ARIAL',
     SIZE=9,$
TYPE=HEADING,
     SIZE=10,
     STYLE=BOLD,
     COLOR=BLUE,$
ENDSTYLE
END
The following procedure, GGRPT1.FEX, creates the second report component for the Coordinated Compound Layout report. For the same store code value in the header report, it displays data from the GG1 data source about the product category Coffee:
TABLE FILE GG1
SUM
     QUANTITY
     UNIT_PRICE
     FST.PACKAGE_TYPE AS ',Package'
     FST.SIZE AS ',Size'
     VENDOR_NAME
BY STORE_CODE AS 'Store'
BY PRODUCT_DESCRIPTION
HEADING
"<PRODUCT_CATEGORY"
" "
ON TABLE SET PAGE-NUM OFF
ON TABLE NOTOTAL
ON TABLE PCHOLD FORMAT HTML
ON TABLE SET HTMLCSS ON
ON TABLE SET STYLE *
     UNITS=IN,
     SQUEEZE=ON,
     ORIENTATION=PORTRAIT,$
TYPE=REPORT,
     GRID=OFF,
     FONT='ARIAL',
     SIZE=9,$
TYPE=DATA,
     SIZE=10,$
TYPE=TITLE,
     STYLE=BOLD,
     SIZE=10,$
TYPE=HEADING,
     SIZE=10,
     STYLE=BOLD,
    COLOR=RED,$
ENDSTYLE
END
The following procedure, GGRPT2.FEX, creates the third report component for the Coordinated Compound Layout report. For the same store code value in the header report, it displays data from the GG2 data source about the product category Food:
TABLE FILE GG2
SUM
     QUANTITY
     UNIT_PRICE
     FST.PACKAGE_TYPE AS ',Package'
     FST.SIZE AS ',Size'
     VENDOR_NAME
BY STORE_CODE
BY PRODUCT_DESCRIPTION
HEADING
"<PRODUCT_CATEGORY"
" "
ON TABLE SET PAGE-NUM OFF
ON TABLE NOTOTAL
ON TABLE PCHOLD FORMAT HTML
ON TABLE SET HTMLCSS ON
ON TABLE SET STYLE *
     UNITS=IN,
     SQUEEZE=ON,
     ORIENTATION=PORTRAIT,$
TYPE=REPORT,
     GRID=OFF,
     FONT='ARIAL',
     SIZE=9,$
TYPE=DATA,
    SIZE=10,$
TYPE=TITLE,
     STYLE=BOLD,
     SIZE=10,$
TYPE=HEADING,
     SIZE=10,
     STYLE=BOLD,
     COLOR=RED,$
ENDSTYLE
END
The following procedure, GGRPT3.FEX, creates the final report component for the Coordinated Compound Layout report. For the same store code value in the header report, it displays data from the GG3 data source about the product category Gifts:
TABLE FILE GG3
SUM
     QUANTITY
     UNIT_PRICE
     FST.PACKAGE_TYPE AS ',Package'
     FST.SIZE AS ',Size'
     VENDOR_NAME
BY STORE_CODE
BY PRODUCT_DESCRIPTION
HEADING
"<PRODUCT_CATEGORY"
" "
ON TABLE SET PAGE-NUM OFF
ON TABLE NOTOTAL
ON TABLE PCHOLD FORMAT HTML
ON TABLE SET HTMLCSS ON
ON TABLE SET STYLE *
     UNITS=IN,
     SQUEEZE=ON,
     ORIENTATION=PORTRAIT,$
TYPE=REPORT,
     GRID=OFF,
     FONT='ARIAL',
     SIZE=9,$
TYPE=DATA,
     SIZE=10,$
TYPE=TITLE,
     STYLE=BOLD,
     SIZE=10,$
TYPE=HEADING,
     SIZE=10,
     STYLE=BOLD,
     COLOR=RED,$
ENDSTYLE
END
Example: Step 3: Building the Coordinated Compound Layout Report
The following procedure, GGCMPD.FEX, combines the four components into a Coordinated Compound Layout report. The reports and relative positioning for each component is presented in the following diagram:
The Coordinated Compound Layout syntax is:
SET HTMLARCHIVE=ON
COMPOUND LAYOUT PCHOLD FORMAT PDF
UNITS=IN, $
SECTION=section1, LAYOUT=ON, MERGE=ON, ORIENTATION=PORTRAIT,
   PAGESIZE=Letter,  $
PAGELAYOUT=1, NAME='Page layout 1', text='Page layout 1',
   TOC-LEVEL=1, BOTTOMMARGIN=0.5, TOPMARGIN=0.5,  $
COMPONENT='report1', TEXT='report1', TOC-LEVEL=2,
   POSITION=(0.667 1.083), DIMENSION=(3.417 1.412),  $
COMPONENT='report2', TEXT='report2', TOC-LEVEL=2,
   POSITION=(0.837 2.584), DIMENSION=(* *),  $
COMPONENT='report3', TEXT='report3', TOC-LEVEL=2,
   POSITION=(-0.006 +0.084), DIMENSION=(* *),
   RELATIVE-TO='report2', RELATIVE-POINT=BOTTOM-LEFT,
   POSITION-POINT=TOP-LEFT, $
COMPONENT='report4', TEXT='report4', TOC-LEVEL=2,
   POSITION=(+0.010 +0.080), DIMENSION=(* *),
   RELATIVE-TO='report3', RELATIVE-POINT=BOTTOM-LEFT,
   POSITION-POINT=TOP-LEFT, $
END
SET COMPONENT='report1'
-INCLUDE GGHDR.FEX
SET COMPONENT='report2'
-INCLUDE GGRPT1.FEX
SET COMPONENT='report3'
-INCLUDE GGRPT2.FEX
SET COMPONENT='report4'
-INCLUDE GGRPT3.FEX
COMPOUND END
On the first page of the PDF output file, all components have data and appear on the report output:
On the second page, report GGRPT2.FEX did not retrieve any data for the store in the header. Therefore, the Coffee component is missing. Note that because Component 3 and 4 are positioned RELATIVE-TO the components defined above them in the Compound Layout syntax, the Food and Gifts components move up instead of leaving blank space where the Coffee component would have been:
On page 5, the header report did not retrieve any data for a store code value present in the other three components. A page is still generated for this store code. Since the second component (Coffee report) was positioned absolutely in the Compound Layout syntax, not RELATIVE-TO the first component (header report), the space where the header report would have been is left blank: