|
In this section: |
The values you select for the X- and Y-axes determine what data is included in the graph you are creating, and how it appears.
The X-axis value is determined by the sort phrase (BY or ACROSS) used in your GRAPH request. At least one sort phrase is required in every GRAPH request. When there are multiple BY phrases or when an ACROSS and BY phrase are included in the same request, multiple graphs are generated, one for each combination of values for the fields referenced in the request. For details, see Creating Multiple Graphs.
The Y-axis value is determined from the display field associated with the display command (SUM or PRINT) issued in your GRAPH request.
You can also:
- Select a second horizontal category (X axis), which will produce multiple graphs. For details, see Creating Multiple Graphs.
- Temporarily hide the display of a Y-axis field. For details, see Hiding the Display of a Y-Axis Field.
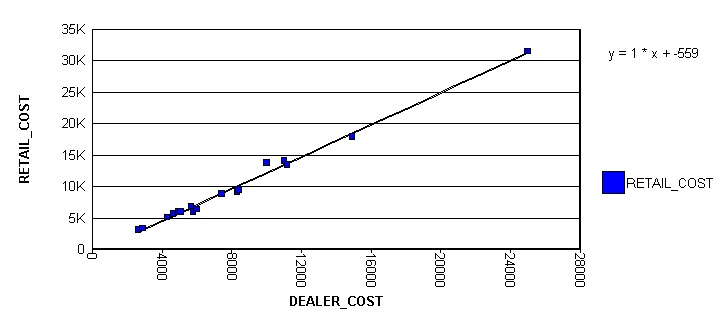
- Interpolate X and Y axis values using linear regression. For details, see Interpolating X and Y Axis Values Using Linear Regression.
Example: Selecting Values for the X and Y Axes
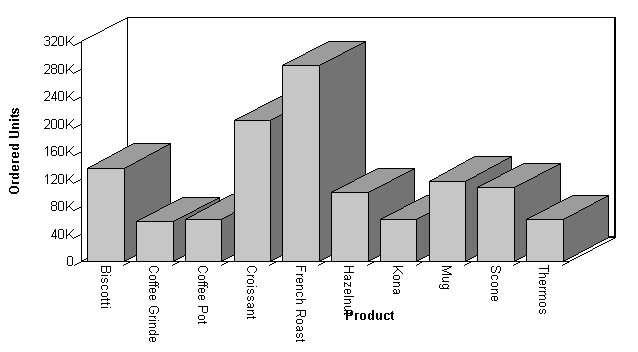
The following illustrates how to set the X-axis (PRODUCT_DESC) using an ACROSS phrase and the Y-axis (QUANTITY) with the display command SUM:
GRAPH FILE GGORDER
SUM QUANTITY AS 'Ordered Units'
ACROSS PRODUCT_DESC
END
The output is:

