Service Details
The Service Details page displays the details of the selected service or reference. You can select a different service or reference to see its details using the View Service list near the Time Range Selector.
Based on the selected service and time period, the Service Details page displays information about the selected service or reference.
Service/Reference Overview
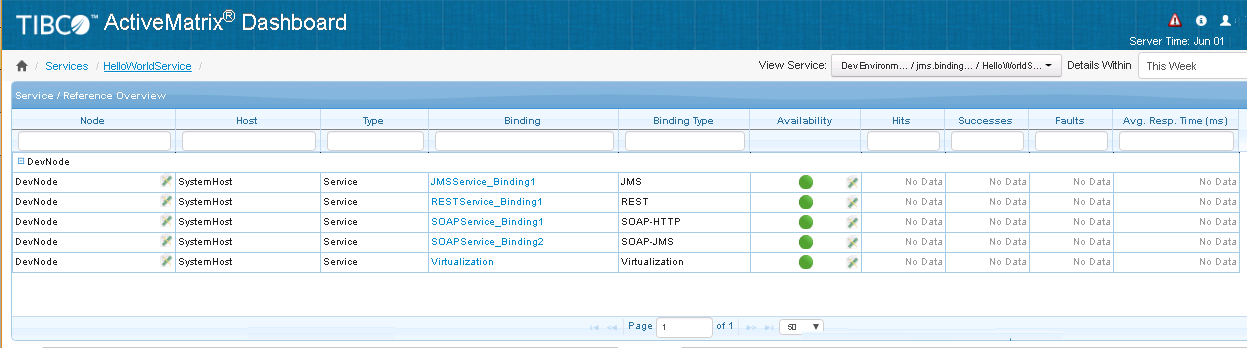
The Service/Reference Overview table displays the details of the nodes on which the selected service is deployed:
| Column | Description |
|---|---|
| Node | Lists the nodes on which the selected service or reference is deployed
Expanding the nodes shows the bindings on the service or reference. |
| Host | Shows the name of the host on which the node is running |
| Type | Displays the type as service or reference |
| Binding | Shows the name of the binding on the service or reference
Clicking a binding displays the Service Instance Details page. |
| Binding Type | Shows the type of the binding on the service or reference. Supported Bindings are:
|
| Availability | Shows the availability of the node as indicated by the status marker
For more information, see Asset Status. |
| Hits | The total number of hits for the selected service or reference
This number includes hits to the service and to internal services if a virtual binding is used between TIBCO ActiveMatrix components. |
| Successes | The number of successful responses for the selected service or reference
This number includes successful responses for the service and internal services if a virtual binding is used between TIBCO ActiveMatrix components. |
| Faults | The number of faults encountered by the selected service or reference
This number includes faults encountered by the service and internal services if a virtual binding is used between TIBCO ActiveMatrix components. |
| Average Response Time (ms) | Shows the average response time of the selected service or reference in milliseconds |
| Operation | This column in the ClientIP View table shows the SPM User, the Operation invoked by the Client from a specific IP Address, and aggregated metrics based on the Client IP address and the Operation. |
For more information about using tables, see Working with Tables.
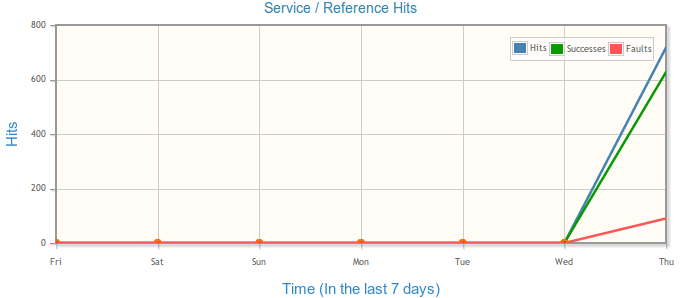
Service/Reference Hits
The Service/Reference Hits chart displays the hits for the selected service, where:
- X-axis represents the time period you select from the Time Range Selector
- Y-axis represents the hit count
If there is no data at a particular point of time, it is plotted on the chart as an orange circle.
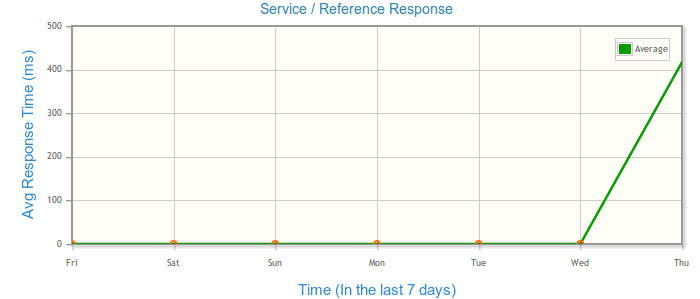
Service / Reference Response
The Service/Reference Response chart displays the response for the selected service, where:
- X-axis represents the time period you select from the Time Range Selector
- Y-axis represents the aggregated average response time of the service across all service types
For example, if the selected time period is Today, the average response time is computed for one hour time slots.
If there is no data at a particular point of time, it is plotted on the chart as an orange circle.