Service Instance Details
The Service Instance Details page displays the details of the selected service instance.
Based on the selected service instance and time period, the Service Instance Details page displays information about the selected service instance.
Service/Reference Instance Overview
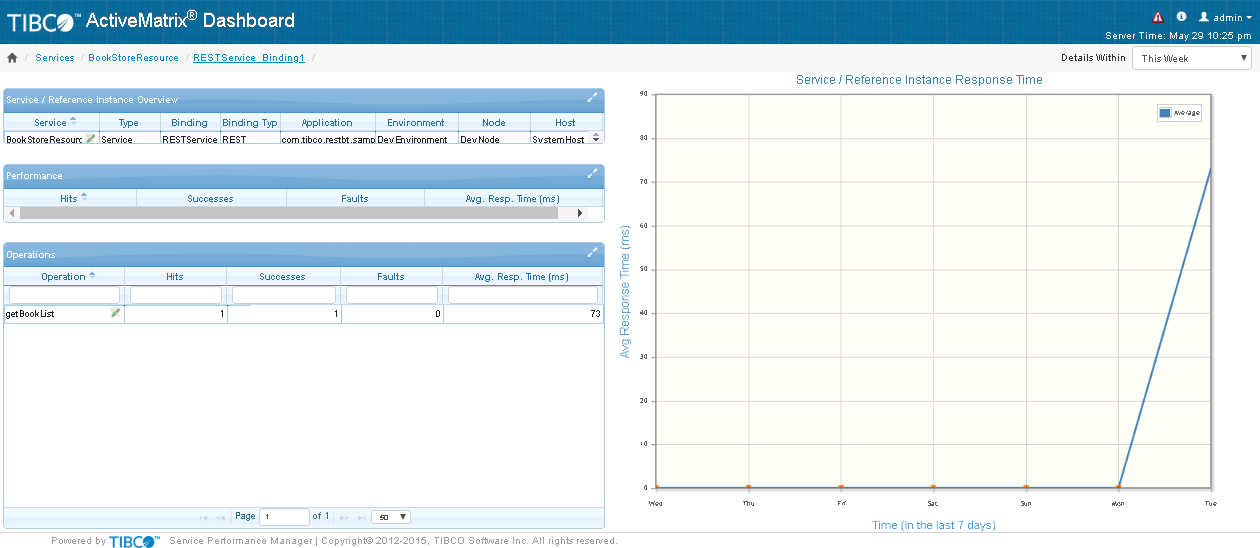
The Service/Reference Instance Overview table displays information of the selected service instance or reference instance:
For more information on using tables, see Working with Tables.
Performance
The Performance table displays the performance of the selected service/reference instance:
| Column | Description |
|---|---|
| Hits | The total number of hits for the selected service/reference instance
This number includes hits to the service instance and to internal service instances if a virtual binding is used between TIBCO ActiveMatrix components. |
| Successes | The number of successful responses for the selected service/reference instance
This number includes successful responses for the service instance and internal service instances if a virtual binding is used between TIBCO ActiveMatrix components. |
| Faults | The number of faults encountered by the selected service/reference instance
This number includes faults encountered by the service instance and internal service instances if a virtual binding is used between TIBCO ActiveMatrix components. |
| Average Response Time (ms) | Shows the average response time of the selected service/reference instance in milliseconds |
For more information on using tables, see Working with Tables.
Operations
The Operations table displays the operations of the selected service/reference instance:
| Column | Description |
|---|---|
| Operations | Lists the operations of the selected service/reference instance |
| Hits | The total number of hits for the operation
This number includes hits to the service instance and to internal service instances if a virtual binding is used between TIBCO ActiveMatrix components. |
| Successes | The number of successful responses for the operation
This number includes successful responses for the service instance and internal service instances if a virtual binding is used between TIBCO ActiveMatrix components. |
| Faults | The number of faults encountered by the operation
This number includes faults encountered by the service instance and internal service instances if a virtual binding is used between TIBCO ActiveMatrix components. |
| Average Response Time (ms) | Shows the average response time of the operation in milliseconds |
For more information on using tables, see Working with Tables.
Service/Reference Instance Response
The Service/Reference Instance Response Time chart displays the response for the selected service instance, where:
- X-axis represents the time period you select from the Time Range Selector
- Y-axis represents the aggregated average response time of the service instance
For example, if the selected time period is Today, the average response time is computed for one hour time slots.
If there is no data at a particular point of time, it is plotted on the chart as an orange circle.
ClientIP View
This table displays the information about client IP addresses:
| Column | Description |
|---|---|
| ClientIP | Lists the IP addresses of clients for the selected service instance |
| Operation |
Shows the operation name of the service invoked by the client. |
| Resource Name | Shows the name of the corresponding HTTP resource |
| Hits | The total number of hits on the selected service instance
This number includes hits to services and to internal services if a virtual binding is used between TIBCO ActiveMatrix components. |
| Successes | The number of successful responses on the selected service instance
This number includes successful responses for services and internal services if a virtual binding is used between TIBCO ActiveMatrix components. |
| Faults | The number of faults encountered on the selected service instance
This number includes faults encountered by services and internal services if a virtual binding is used between TIBCO ActiveMatrix components. |
| Average Response Time (ms) | Shows the average response time on the selected service instance in milliseconds |
This table displays metrics aggregated based on the sender identifier. The sender identifier is any string/content in the SOAP body that identifies that particular service request. The sender identifier is found based on the XPath expression defined for the service binding or operation.
For more details on sender identifier, refer to Emitting 'Sender Identifier' Information.
| Column | Description |
|---|---|
| SenderId | Unique identifier in the service request. |
| Resource Name | Shows the name of the corresponding HTTP resource |
| Hits |
The total number of hits on the selected service instance This number includes hits to services and to internal services if a virtual binding is used between TIBCO ActiveMatrix components. |
| Successes |
The number of successful responses on the selected service instance This number includes successful responses for services and internal services if a virtual binding is used between TIBCO ActiveMatrix components. |
| Faults |
The number of faults encountered on the selected service instance This number includes faults encountered by services and internal services if a virtual binding is used between TIBCO ActiveMatrix components. |
| Average Response Time (ms) | Shows the average response time on the selected service instance in milliseconds |
For more information on using tables, see Working with Tables.