Health Monitoring Summary
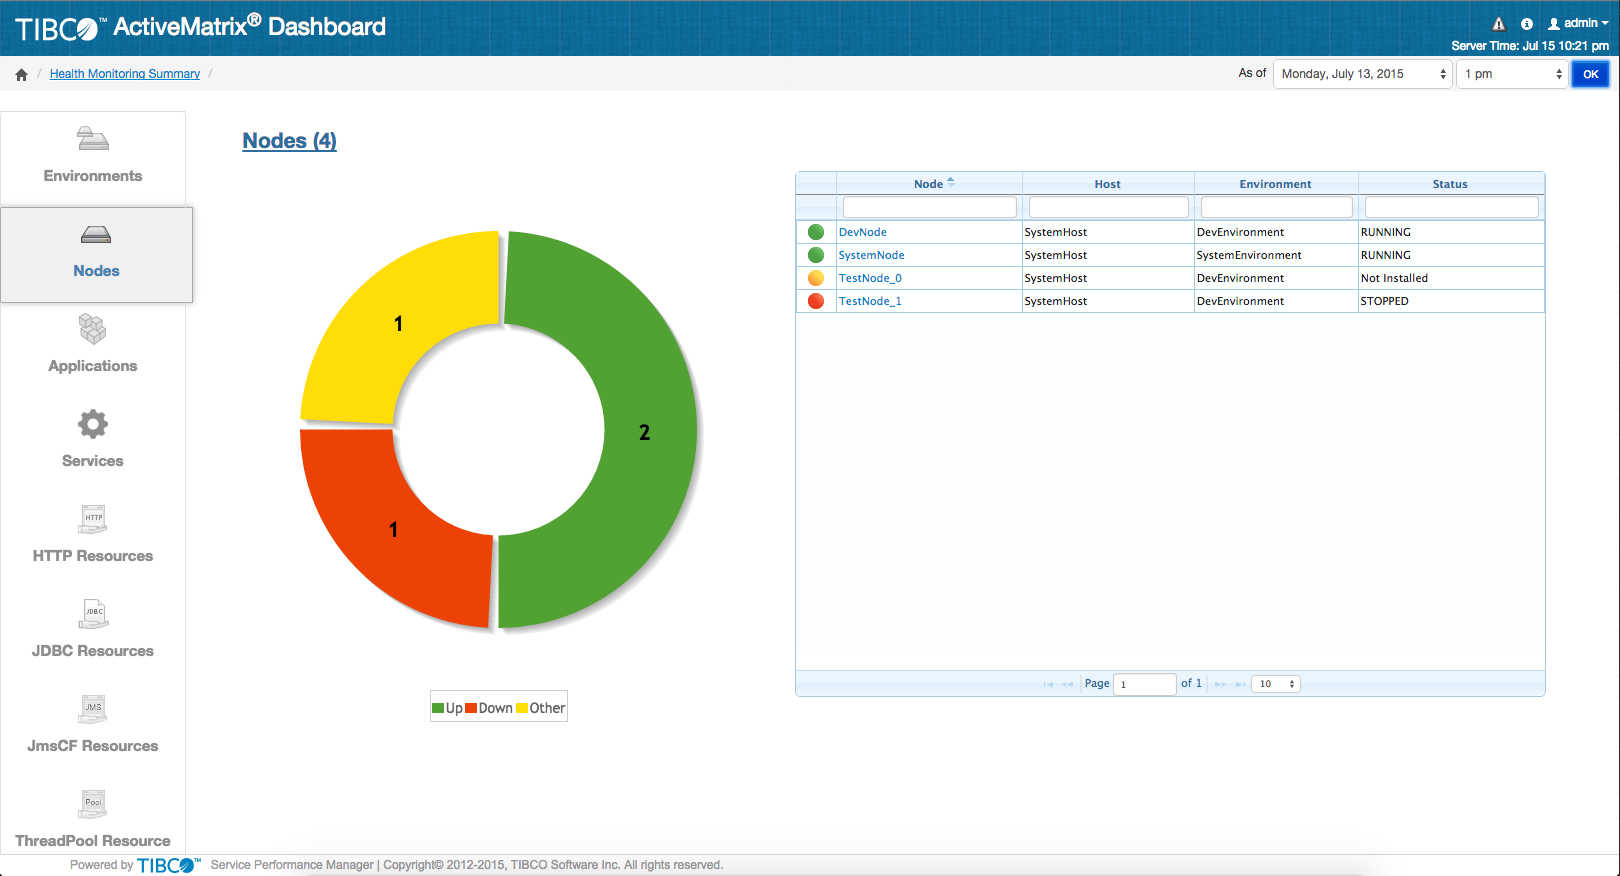
The Health Monitoring Summary dashboard displays the overall status of the enterprise assets in a donut chart.
Clicking a particular type of asset in the left pane, displays the donut chart for that asset type. The number included in brackets after the asset type indicates the number of assets present in the enterprise. You can see how many assets of a particular type are running, stopped, or are in any other state from the donut chart. For information on color codes for asset status, see Asset Status.
Clicking a slice of the donut displays the assets in the corresponding state. For instance, clicking the green slice displays all the assets in the running state.
For each asset type, the columns in the table change to impart relevant information of that asset type. For more information, see Working with Tables.
| Asset Type | Table Columns |
|---|---|
| Environments | Environment lists the environments in the enterprise.
Status shows the status of the environment as sent by TIBCO ActiveMatrix Administrator. |
| Nodes | Node lists the nodes in the enterprise.
Host shows the name of the host on which the node is running. Environment shows the name of the environment to which the host belongs. Status shows the status of the node as sent by TIBCO ActiveMatrix Administrator. |
| Applications | Application lists all the applications in the enterprise.
Environment shows the name of the environment to which the application belongs. Status shows the status of the application as sent by TIBCO ActiveMatrix Administrator. |
| Services | Service lists all the services in the enterprise.
Application shows the application to which the service belongs. Environment shows the environment to which the parent application of the service belongs. Status shows the status of the service as sent by TIBCO ActiveMatrix Administrator. |
| HTTP Resources | Resource Name lists the name of the HTTP Connector.
Node shows the name of the node on which the HTTP Connector is installed. Host shows the name of the host on which the node is running. Environment shows the environment to which the node belongs. Status shows the status of the HTTP Connector as sent by TIBCO ActiveMatrix Administrator. |
| JDBC Resources | Resource Name lists the name of the JDBC Connector.
Node shows the name of the node on which the JDBC Connector is installed. Host shows the name of the host on which the node is running. Environment shows the environment to which the node belongs. Status shows the status of the JDBC Connector as sent by TIBCO ActiveMatrix Administrator. |
| JmsCF Resource | Resource Name lists the name of the JMS ConnectionFactory resource.
Node shows the name of the node on which the JMS ConnectionFactory resource is installed. Host shows the name of the host on which the node is running. Environment shows the environment to which the node belongs. Status shows the status of the JMS ConnectionFactory resource as sent by TIBCO ActiveMatrix Administrator. |
| ThreadPool Resource | Resource Name lists the name of the ThreadPool resource.
Node shows the name of the node on which the ThreadPool resource is installed. Host shows the name of the host on which the node is running. Environment shows the environment to which the node belongs. Status shows the status of the ThreadPool resource as sent by TIBCO ActiveMatrix Administrator. |
Clicking an asset in the table shows the Asset Details page for that asset.