Time Range Selectors
You can query values aggregated over a time period from all the asset details pages. There are two types of time range selectors available on the dashboard.
The Health Monitoring Summary page displays a dual list as a time range selector for selecting the day and hour. By default, the values are aggregated over the current date and hour.
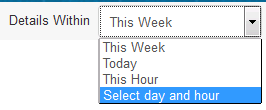
The rest of the asset details pages display a simple time range selector with four options: This Week, Today, This Hour, and Select day and hour. The default is This Week.
For example, the Application Details table shows the distribution of services and reference bindings deployed on nodes. The table shows the hits, successes, faults, and average response time for each such service and reference instance.
If the selected time-window option is This Week, then the measurements (hits, successes, and so on) are displayed as values aggregated for those services over This Week.
Similarly, if the time window is Today, the measurements are shown as values aggregated for Today.
The Application Details charts are trending charts that show how the application is performing over this week, day, or hour. For example, if the time-window selected is Today, the trending chart shows trending hits, success, or faults aggregated for each hour on a last 24-hour time series. The charts exhibit sliding-window behavior. That means, when the clock hour window crosses, the chart shifts to the last 24 hours and the hour bucket prior to the last 24 hours is dropped off.
The chart value-axis depends on the time window selection as follows:
| Time Window Selected | Chart Value Axis (X-axis) |
|---|---|
| This week | Last 7 days (Sun-Mon-…-Sat) |
| Today | Last 24 hrs (19,20,21…..17,18) |
| This hour | Last 60 min (44,46,47,…59,0,1,….42,43) |
| Select day and hour | Last 60 minutes for the selected hour on the selected date |
If selected time-window is Select day and hour, a calendar and an hour drop-down is displayed to select a date and time.

The Application chart or the trending charts for Select day and hour shows hits, success, or faults aggregated for the selected day and hour in minutes interval.