This section describes how to configure nodes and their associated node agents. It also discusses how configuration life cycle is managed.
Node configuration has a configuration type of
nodeconfig.
Node configuration is separated into these distinct areas:
Node wide values
Per JVM values
The node configuration is separated into these distinct areas:
Node description configuration
Memory throttling configuration
Shared memory IPC configuration
Deadlock resolution configuration
Default domain configuration
Table 3.3, “Node description configuration” defines the node description configuration parameters.
The optional memory throttling configuration controls:
Utilization percentage of shared memory at which to start throttling. This is set to the value of the
thresholdPercentageconfiguration parameter.Utilization percentage of shared memory at which to start stalling. This is set to the value of the
thresholdPercentageplus 30 percent.Utilization percentage of shared memory at which to generate a low memory warning. This is set to the value of the
thresholdPercentageplus 30 percent, but not exceeding 90 percent. A low memory warning is always generated at 90 percent utilization.
Throttling and stall states are used internally to prevent memory
exhaustion under extreme loads. They can also be used by an application
for the same reasons using the
com.kabira.platform.swbuiltin.EngineServices.throttle()
API. For details on the throttle API see the product
javadoc.
Table 3.4, “Memory throttling configuration” defines the memory throttling configuration parameters.
Table 3.4. Memory throttling configuration
Table 3.5, “Flusher configuration” defines the shared memory cache flusher configuration parameters.
Table 3.5. Flusher configuration
Table 3.6, “Shared memory IPC configuration” defines the shared memory IPC configuration parameters.
Table 3.7, “Deadlock resolution configuration” defines the deadlock resolution configuration parameters.
Table 3.8, “Default domain configuration” defines the domain configuration parameters.
JVM configuration is defined per JVM by name. Multiple JVM
configuration blocks may be defined. The JVM name is optionally defined
when the JVM is deployed using the jvmname deployment
tool option. If the jvmname option is not specified
when the JVM is deployed, a unique name is generated
automatically.
JVM configuration supports specifying:
Dispatch thread configuration - the simultaneous number of remote method invocations into the JVM.
Timer thread configuration - the number of concurrent timers, and maximum timer resolution.
Runtime tracing configuration
All JVM configuration values, other than the JVM name, are optional. If a JVM configuration is deactivated, all of the configuration parameters are set to their default value.
Table 3.9, “JVM configuration” defines the JVM configuration parameters.
Table 3.9. JVM configuration
The bit field values for the trace configuration parameters are defined in Table 3.10, “Trace flag values”.
Table 3.10. Trace flag values
| Value | Description |
0x00000001 | System services. Low level operating system abstraction layer in runtime. |
0x00000002 | Event bus. Shared memory inter-process dispatch mechanism. |
0x00000004 | Object services. Managed object runtime component. |
0x00000008 | System management. |
0x00000100 | Distribution. |
0x00000400 | Exceptions. |
0x00004000 | Java. Class loader and JVM interaction with runtime. |
0x00008000 | System coordinator. |
0x00010000 | Engine. Process container for a JVM. |
0x00020000 | Shared memory allocator. |
0x00100000 | Distributed discovery. |
0x00200000 | Distribution protocol. Trace the distribution Protocol Data Units. |
0x01000000 | Security. |
Example 3.1, “Node configuration example” is an example node and JVM configuration.
Example 3.1. Node configuration example
configuration "Node A" version "3.0" type "nodeconfig"
{
     configure switchadmin
     {
          configure Node
          {
               //
               //     Set the node description and add
               //     a service property of foo=bar to the
               //     node service record
               //
               Description
               {
                    defaultDescription = "Development";
                    properties =
                    {
                         {
                              name = "foo";
                              value = "bar";
                         }
                    };
               };

               //
               //     Shared memory flusher control
               //
               Flusher
               {
                    flushIntervalSeconds = 2;
                    maximumTypes = 3;
                    maximumObjectsPerType = 4;
               };

               //
               //     Set a memory utilization threshold of 50%
               //     and check 5 times a second
               //
               MemoryThrottle
               {
                    thresholdPercentage = 50;
                    frequency = 5;
               };

               //
               //     Set the no destination timeout value to 10 seconds
               //     for the Shared memory IPC mechanism
               //
               EventBus
               {
                    noDestinationTimeoutSeconds = 10;
               };


               //
               //    Set the maximum deadlock backoff resolution to 5 seconds
               //
               Deadlock
               {
                    maximumBackoffMilliseconds = 5000;
               };

               //
               //     Join the Application Cluster group in
               //     the Development domain
               //
               Domain
               {
                    name = "Development";
                    group = "Application Cluster";
               };
          };

    };

    configure switchadmin
    {
          JVM
          {
               jvmName = "My JVM";

               //
               //    Configure dispatch threads
               //
               minimumDispatchThreads = 8;
               maximumDispatchThreads = 16;

               //
               //    Allow four concurrent timers with a 500 millisecond resolution
               //
               timerParallelism = 4;
               timerResolutionMilliseconds = 500;

               //
               //    Update runtime trace flags
               //
               traceDebugFilter = 0x0;
               traceInfoFilter = 0x3FFFFFF;
               traceWarningFilter = 0x3FFFFFF;
               traceFatalFilter = 0x3FFFFFF;
          };
     };
};
Node agent configuration has a configuration type of
nodeagent.
Table 3.11, “Node agent configuration” defines the node agent configuration parameters.
Table 3.11. Node agent configuration
![[Warning]](images/warning.png) | |
The node agent |
Example 3.2, “Example node agent configuration” is an example node agent configuration.
Example 3.2. Example node agent configuration
configuration "nodeagent" version "2.0" type "nodeagent"
{
     configure nodeagent
     {
          NodeAgentConfiguration
          {
               enableEventForwarding = true;
               enableTraceToEvent = true;
               numberOfMessages = 1000;
               listenAddress = "TCP::0";
               topicNameList =
               {
                    "kabira.kis",
                    "kabira.kts"
               };
          };
     };
};A complete discussion of configuration life cycle can be found in the TIBCO BusinessEvents® Extreme Java Developer's Guide. In summary configuration follows this life-cycle:
Configuration is loaded into a node
Configuration is activated
Configuration is deactivated
Configuration is removed from a node
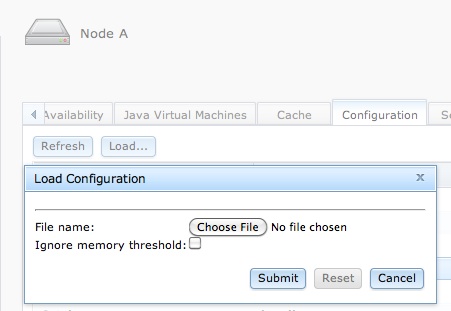
Configuration is loaded into a node using either the TIBCO BusinessEvents® Extreme Administrator dialog show in Figure 3.10, “Loading configuration” or this command:
administrator servicename=A load configuration source=myConfiguration.kcs
The Ignore memory threshold check box is used
to allow configuration data to be loaded in shared memory even if the
configured shared memory throttle utilization is exceeded (see Table 3.4, “Memory throttling configuration”). Without this override, attempting
to load configuration data into congested shared memory will
fail.
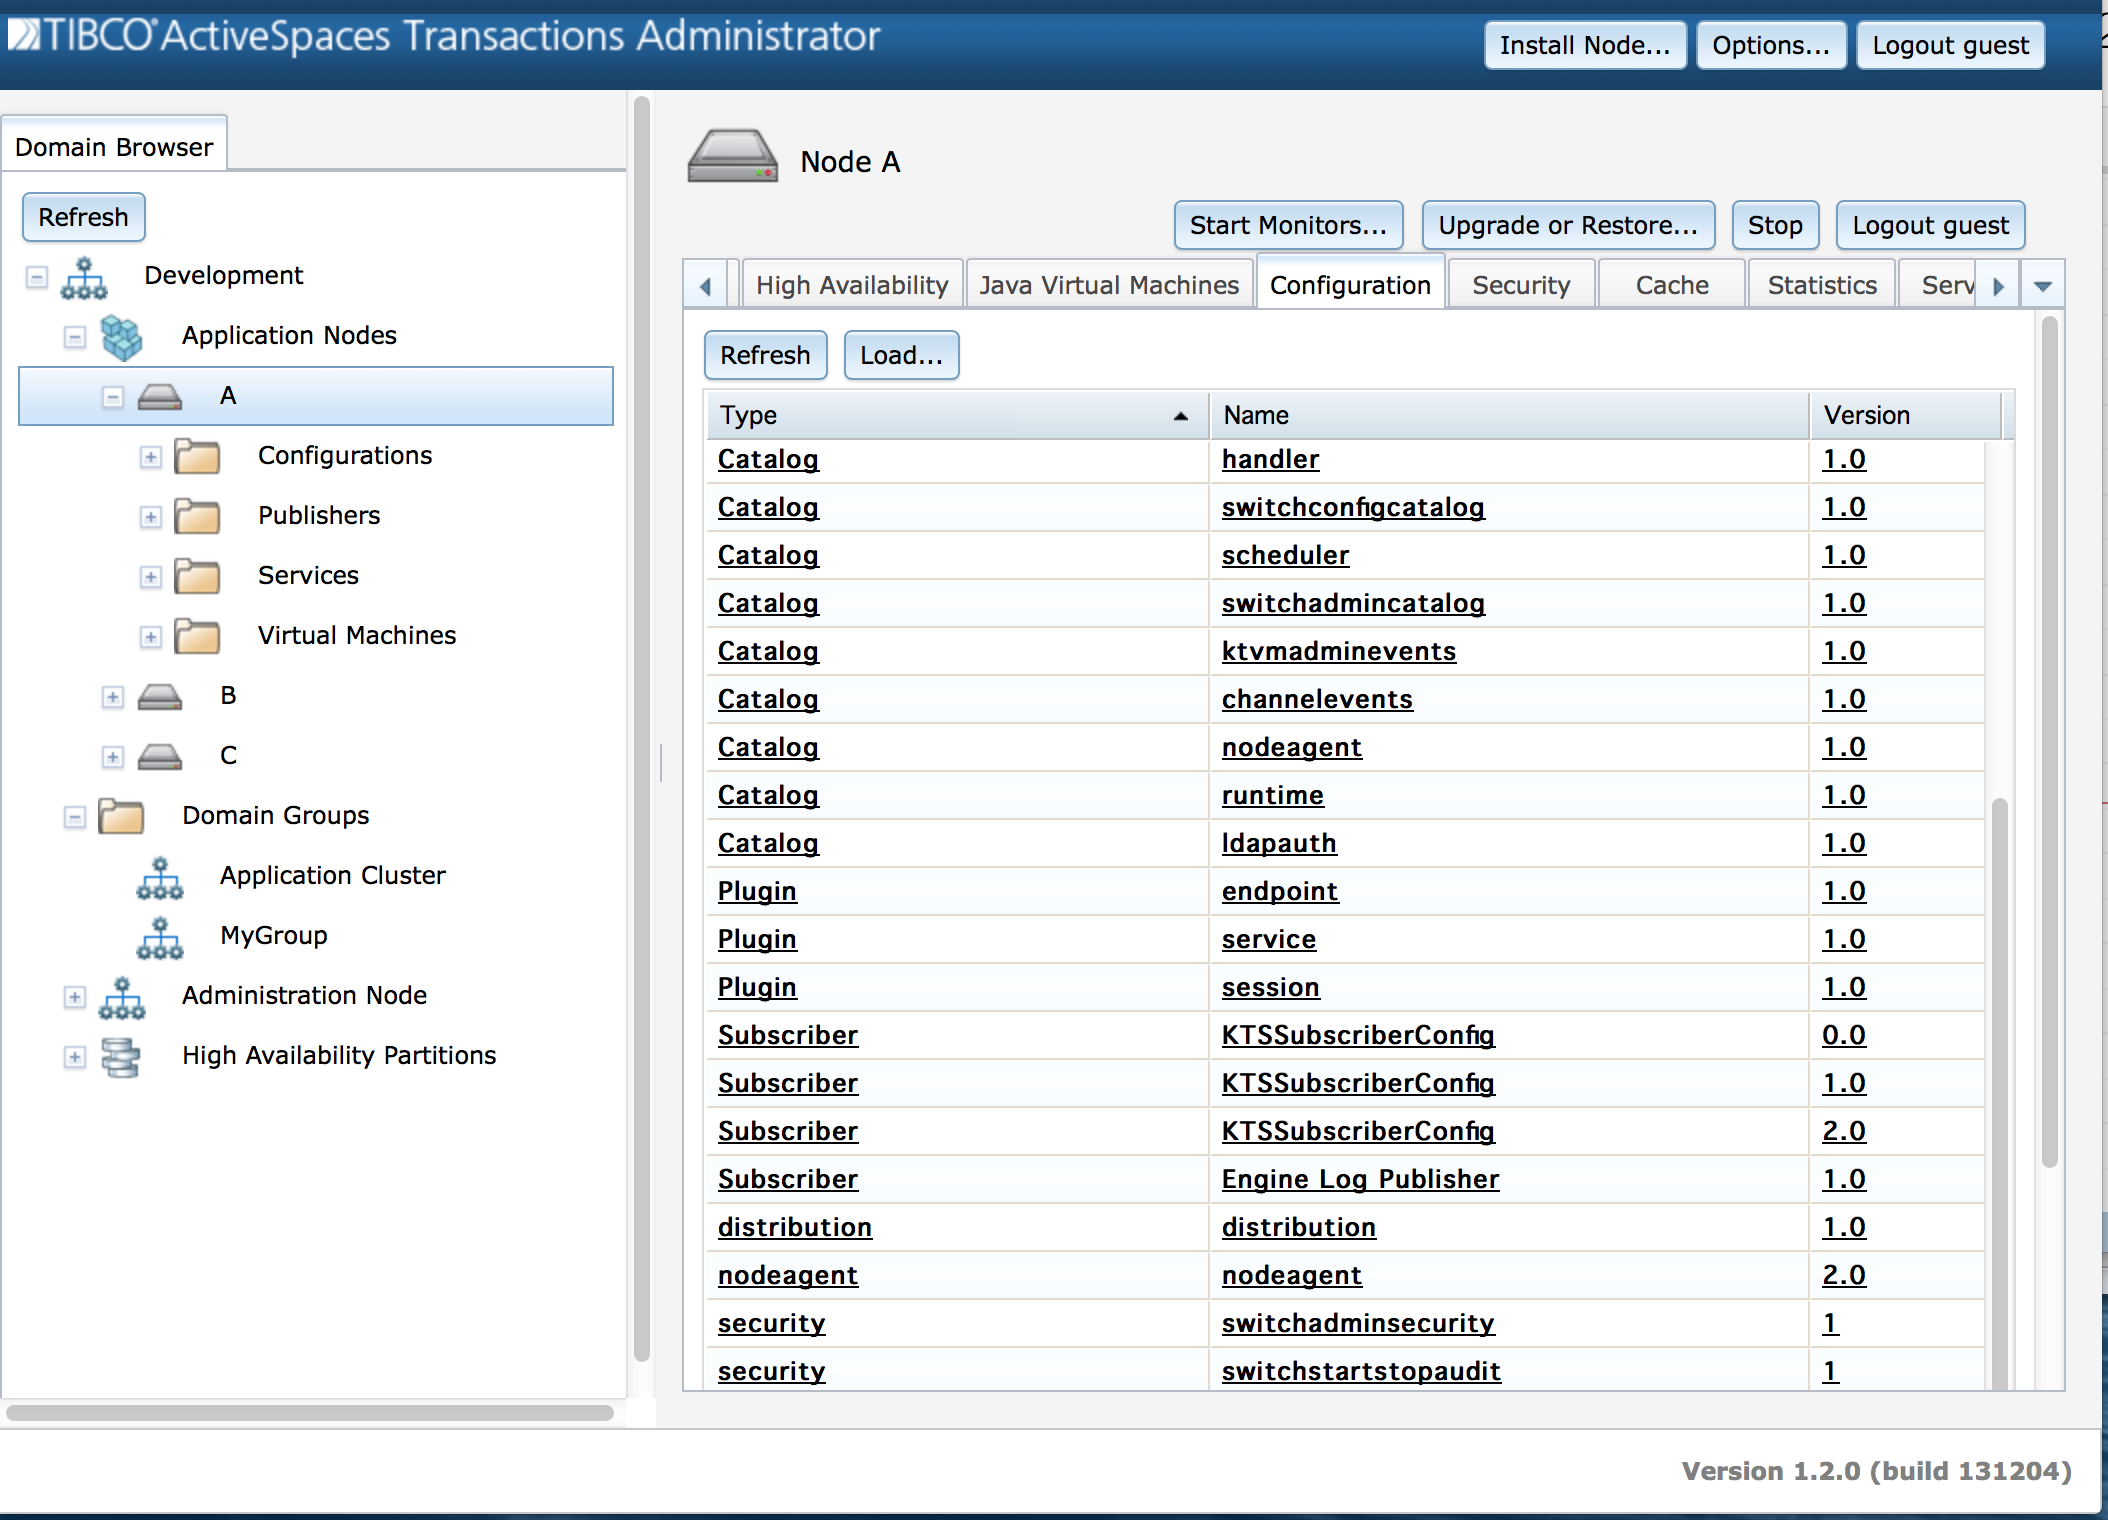
All loaded configuration data can be displayed from the
Configuration tab for a node as shown in Figure 3.11, “Loaded configuration”, or using this
command:
administrator servicename=A display configuration
This information is displayed for each loaded configuration file:
Type - Configuration type.
Name - Configuration name.
Version - Configuration version.
State - Current state.
State Change Time - Time of last state change.
Load Time - Time configuration file was loaded.
Initial Activation Time - Initial time configuration was activated.
Source - Configuration source file path.
Number of Configuration Objects - Number of objects created from the configuration file.
Principal - User that last changed configuration state.
Configuration activation, deactivation, and removal is done from the TIBCO BusinessEvents® Extreme Administrator configuration screen show in Figure 3.12, “Managing configuration”.
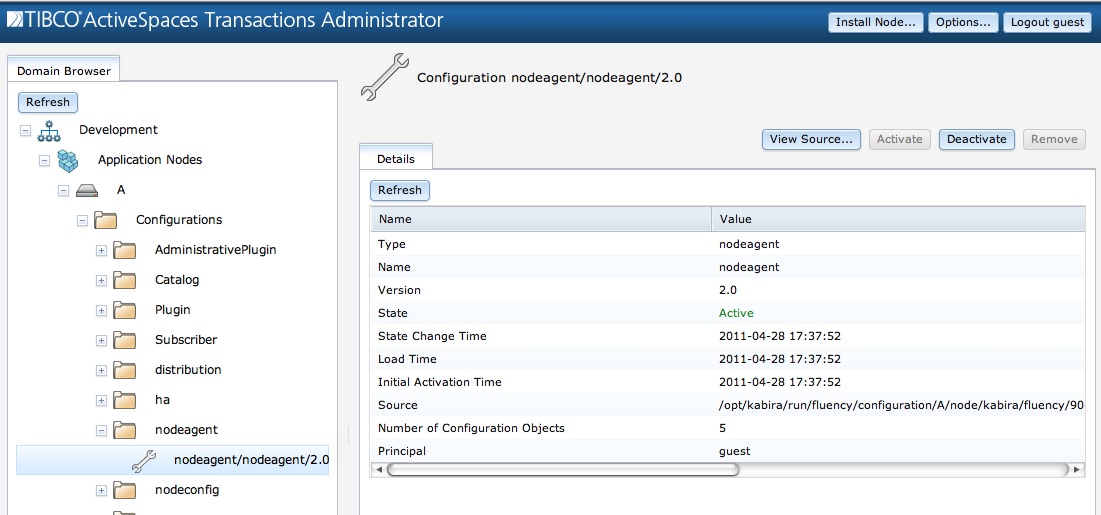
Configuration state changes and also be done using these commands:
//
//  Activate a deactive configuration
//
administrator servicename=A activate configuration type=distribution name=distribution version=1.0

//
//  Deactivate an active configuration
//
administrator servicename=A deactivate configuration type=distribution name=distribution version=1.0

//
//  Remove configuration from shared memory
//
administrator servicename=A remove configuration type=distribution name=distribution version=1.0
The button shown in Figure 3.12, “Managing configuration” can be used to export loaded configuration in a format that can be modified and reloaded. Configuration can also be exported using this command:
administrator servicename=A export configuration type=distribution name=distribution version=1.0