Shared memory usage has these parts:
a base system usage by the TIBCO BusinessEvents® Extreme runtime
usage by Managed objects
in-flight transaction logging
usage by replica objects
usage by cached objects
The base system usage for an TIBCO BusinessEvents® Extreme
node can be
determined by displaying the Memory Usage from the
node Statistics tab on an unloaded node (i.e. No
application running, no application usage of memory). This display
reports on the total shared memory, the current shared memory usage and
the current shared memory throttling state:
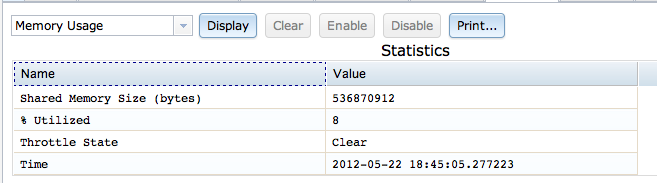
As shown in Figure 2.1, “Memory Usage”, an TIBCO BusinessEvents® Extreme node base system usage is 21% of 512 megabytes, or 100 megabytes. This base footprint will increase slightly as managed object classes are loaded.
Managed objects persist their state in shared memory until
they are explicitly deleted by the application. The shared memory usage
of a managed object can be determined programmatically by creating an
instance of the managed object, populating it with typical data values,
and passing it to the
com.kabira.platform.osstats.Type.memorySize()method
![[Warning]](images/warning.png) | |
The call to the |
This is shown in Example 2.1, “Object size snippet”:
Example 2.1. Object size snippet
// $Revision: 1.1.2.4 $
package com.kabira.snippets.sizing;

import com.kabira.platform.ManagedObject;
import com.kabira.platform.Transaction;
import com.kabira.platform.annotation.Key;
import com.kabira.platform.annotation.Managed;
import com.kabira.platform.osstats.Type;

/**
 *  Display Managed object memory usage.
 * <p>
 * <h2> Target Nodes</h2>
 * <ul>
 * <li> <b>domainnode</b> = A
 * </ul>
 */
public class ObjectSize
{
    /**
     * Sample application object
     */
    @Managed
    @Key(name = "ByName", fields =
    {
        "name"
    }, unique = true, ordered = false)
    private static class MyObject
    {
        static final int NUMBER_OF_ELEMENTS = 100;
        String[] stringArray;
        final String name;

        /**
         * When created, populate this instance with some data
         */
        public MyObject(String name)
        {
            this.name = name;

            stringArray = new String[NUMBER_OF_ELEMENTS];

            for (int i = 0; i < NUMBER_OF_ELEMENTS; i++)
            {
                stringArray[i] = Integer.toString(i);
            }
        }
    }

    /**
     * Main entry point
     * @param args  Not used
     */
    public static void main(String[] args)
    {
        //
        //	Create the objecct
        //
        new Transaction("Create Object")
        {
            @Override
            protected void run() throws Rollback
            {
                MyObject myObject = new MyObject("Sample");
            }
        }.execute();

        //
        //	Report object size - this must be done in a separate
        //	transaction.  It only works for committed objects.
        //
        new Transaction("Report Object Size")
        {
            @Override
            protected void run() throws Transaction.Rollback
            {
                for (MyObject myObject : ManagedObject.extent(MyObject.class))
                {
                    System.out.println(new Type().memoryUsage(myObject));
                    ManagedObject.delete(myObject);
                }
            }
        }.execute();
    }
}
This program's output will be similar to the following:
Allocation type:	# of bytes,	allocator bucket size,	notes
=====================================================================
metadata:	480, 592, spaces: [allocation=64] [system=24] [lock=112]
key com.kabira.snippets.sizing.ObjectSize$MyObject::ByName:	128, 208
array com.kabira.snippets.sizing.ObjectSize$MyObject::stringArray:	1006 (aligned 1008), 1168
optimal allocationSpaceBytes = 1032
event queue:	0, 0
Total:	1614	1968
The output has three columns:
Allocation type- what part of the object this allocation deals with.metadata- Object data. This allocation is broken into two or three parts. Thesystemspace which includes the storage for all fixed length object fields, and pointers to non-fixed length fields, and the runtime overhead. Theallocationspace is the size of the allocation done to store the data for variable length object fields.For types where the
dynamicLockMemoryelement of the@Managedannotation has been left (or set to) its default setting offalsethere will also be a lock portion of the metadata, which shows the size of the space being used for the transaction lock.transaction lock memory- For types where thedynamicLockMemoryhas been set totruethere will be an additional line of report output, which shows the space used by the transaction lock that is dynamically allocated and de-allocated each time the object is locked within a transaction:transaction lock memory: 112, 208, dynamic
This setting reduces memory utilization by instances of objects when they are not locked within a transaction at the cost of increased CPU path length and reduced scalability when the object is accessed.
key- One entry for the value of each defined key. This allocation is used to populate the indexes and is a separate allocation from the storage for the object fields covered by the key.array- An array field, including storage for the array elements.string- A string field, including storage for the data.
# of bytes- the number of bytes requested for this part of the allocation.allocator bucket size- the number of bytes actually allocated. Allocations are fitted to the nearest fixed shared memory allocator bucket size.
The final line of the report shows the total memory requested and the actual memory allocated.
An addition line of the report shows the optimal size for the
allocation space. At object creation, by default, the
runtime chooses a small value for the allocation
space. User data for strings and arrays that does not fit within this
space causes additional memory allocations. If the optmial size is
different than the allocation space shown in the
metadata line of the report space and peformance
savings may be gained by expliciting setting it via the
allocationSpaceBytes element of the
Managed annotation. From the example above, change
the setting to 1032 bytes:
      @Managed(allocationSpaceBytes = 1032)
      @Key(name = "ByName", fields =
      {
         "name"
      }, unique = true, ordered = false)
      private static class MyObject
Re-running the modified class, results in:
      Allocation type:	# of bytes,	allocator bucket size,	notes
      =====================================================================
      metadata:	1336, 1424, spaces: [allocation=1032] [system=24]
      key com.kabira.snippets.sizing.ObjectSize$MyObject::ByName:	136, 240
      optimal allocationSpaceBytes = 1032
      event queue:	0, 0
      Total:	1472	1664
Transaction allocation pages are created during in-flight transactions to manage write and read images (snapshots) of the object. The memory used for in-flight transactions pages is equivalent to the size of the object fields. The transaction page is released when the transaction commits or aborts. The total amount of memory consumed for transaction pages should be multiplied by the number of concurrent transactions to get the total impact on shared memory size. For example, if a system is running at 1000 transactions / second, and each transaction creates a transaction page of a 50 byte object, the in-flight transaction log size is 1000 * 50, or 50,000 bytes.
Finally, any replica objects on a node consume shared
memory. The amount of shared memory consumed by a replica object is the
same as the shared memory consumed by the object on its active node,
which can be calculated using the
com.kabira.platform.Type.memoryUsage()method as
discussed above.
Distributed managed objects support caching a sub-set of the objects in shared memory. Cached objects consume the same amount of shared memory as non-cached managed objects. When cached objects are flushed their index data is also removed from shared memory.
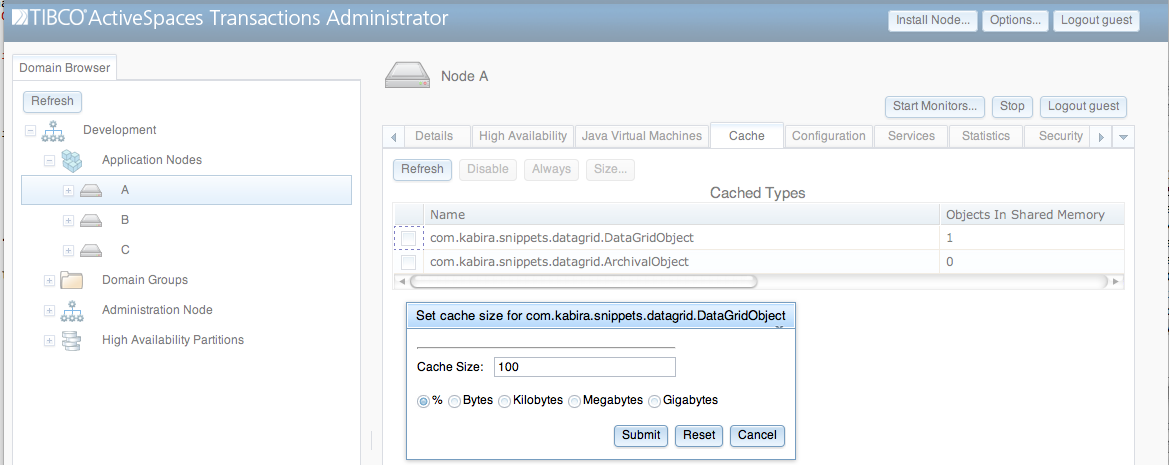
The total shared memory consumed by cached objects can be
explicitly controlled. The allocated cache size includes both object
and index data in shared memory. The size of the shared memory cache
can be specified as an absolute value or as a percentage of the shared
memory available to the node. The cache size is set per node using
TIBCO BusinessEvents® Extreme
Administrator. Figure 2.2, “Setting cache size”
shows setting the cache size for the
com.kabira.snippets.datgrid.DataGridObject class to
15% of the total shared memory allocated on the A
node.
JVM heap memory usage in TIBCO BusinessEvents® Extreme follows normal JVM heap usage, with the following differences:
Array fields in Managed objects only consume the size of an object reference (8 bytes).
Managed objects have an additional, internal 24 byte field used as a shared memory identifier.
POJO fields, for POJOs with the Transactional annotation, when transactionally locked and modified, will temporarily consume heap memory to log their before state. The memory used will be equivalent to the size of the fields before they are modified and is released when the transaction commits or aborts. The number of concurrent transactions should also be taken into account.
A TIBCO BusinessEvents® Extreme node consists of a small number of processes communicating through shared memory to provide the TIBCO BusinessEvents® Extreme runtime services. The total size of the code that may be executed by these processes is approximately 100 megabytes. This is a system wide (per-server) cost, and not a per-process cost, because the code is contained in shared objects (.so) files.
A typical Unix installation requires adding at least as much swap space as there is physical memory. However it is highly recommended that a machine running a TIBCO BusinessEvents® Extreme system have enough physical memory so that it never needs to swap. Swapping runs at disk speeds, TIBCO BusinessEvents® Extreme is designed to run from memory, at memory speeds.