Creating dashboards
Overview
Dashboards act as containers and serve several purposes:
They organize sections and indicators at the highest level.
They play a role in access control.
They are the main entry point for viewing indicators.
A section's main purpose and function is, at a mid-level, to allow you to group indicators according to your taxonomical requirements.
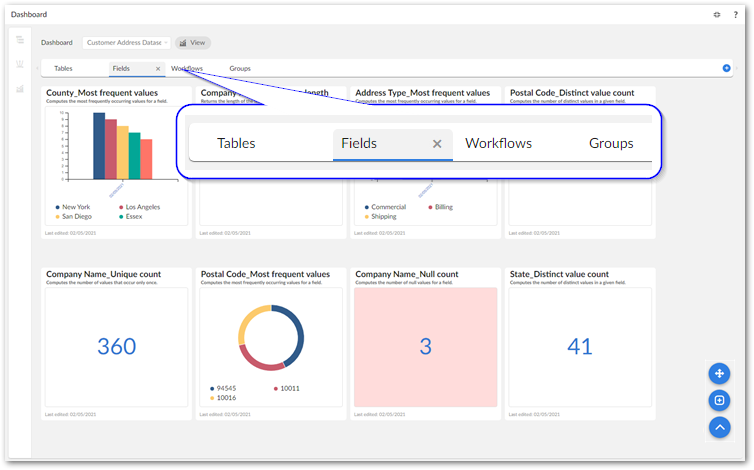
The image below shows an example where the dashboard represents a dataset and each section an asset type contained in the dataset:
The next section describes how to get started using the add-on by creating a dashboard.
Creating a dashboard
You can use the Create a dashboard service to create a dashboard. After an administrator has enabled this service for your EBX® profile, you can access the service in the following locations:
Open the Actions menu when viewing a dataspace or dataset. You must use this method when creating your first dashboard.
When viewing an existing dashboard, open the Actions menu.
Note
You can only add indicators to sections in a dashboard. See Adding sections for instructions on adding sections.
The following image and descriptions highlight options:
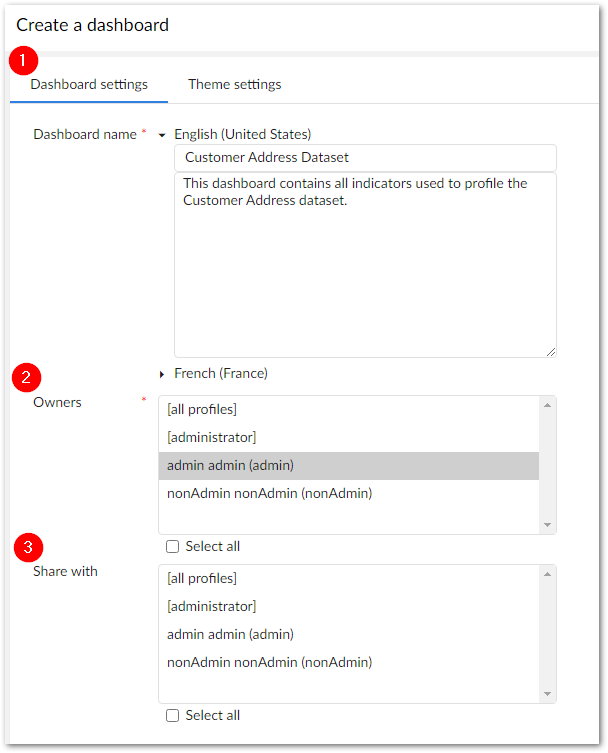
1) Dashboard settings, Theme settings, Dashboard name: | The Dashboard settings tab allows you to name and describe the dashboard. Additionally, it provides options for sharing and allowing other profiles to edit. The Theme settings tab allows you to select, create and edit themes to adjust the dashboard look and feel. Theme settings apply to indicator charts and legends. Add the localized name and optionally a description for this dashboard. |
2) Owner: | Set the owners of this dashboard. Owners have CRUD capabilities. By default the owner is set to you. Note that all profiles are shown here. However, before a user can access any dashboard, an administrator must add the user's profile to the add-on's permissions table. |
3) Share with: | Choose one or more users or profiles to share the dashboard with. The allowed profiles can select this dashboard from their list of available dashboards. |
After saving and closing, your new dashboard displays in edit mode where you can add sections and indicators.