If your data has location columns (latitude and longitude) from
around the globe, and you want the user to be able to interact with the globe,
you can create a graphic using the
TERR-compatible
threejs package.
About this task
You can use RStudio
to create this interactive globe map, or you can use the
TERR
console and display the results in a browser. Perform this task from either
RStudio or the
TERR
console.
Before you begin
TERR, access to the internet, and a browser.
Procedure
-
From the TERR console or RStudio
prompt,
install the threejs and maps packages.
install.packages(c("threejs", "maps"))
TERR checks the repository for the
packages to install, and then installs them along with any packages they
require.
-
Call the
library function to load the required packages.
library("threejs")
library("maps")
The packages and their required packages
are loaded, and messages about any object masking are displayed, along with any
warnings regarding TERR differences.
-
Call the utils function
, passing in the data set
world.cities contained in the maps package.
data(world.cities, package="maps")
-
Sort the top thousand entries of the
pop (population) column from world.cities into
decreasing order, and assign the result to the object
cities.
cities <- world.cities[order(world.cities$pop,decreasing=TRUE)[1:1000],]
-
Create the scale for mapping the cities by calculating the
percentage of size for each entry in
cities, and then assign it to the object
value.
This step establishes a comparison among the largest to smallest
values in the
cities object that can be shown reasonably on the
globe.
value <- 100 * cities$pop / max(cities$pop)
-
Call the grDevices package function
rainbow.
col <- rainbow(10,start=2.8/6,end=3.4/6)
col <- col[floor(length(col)*(100-value)/100) + 1]
This step sets the gradient of colors of the markers, and then
calls the base package function
floor to set the length.
-
Call the threejs function
globejs, passing in the arguments.
globejs(lat=cities$lat, long=cities$long, value=value, color=col,
    atmosphere=TRUE)
This step renders the globe and displays the markers for
cities, as defined by
col.
lat
is set to the lat column in the
cities data.
long
is set to the long column of the
cities data.
value
specifies using the percentage comparisons.
atmosphere specifies
to display the WebGL atmosphere effect.
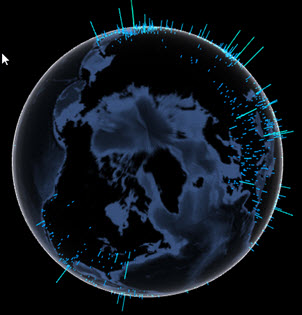
Results
A browser opens,
displaying an interactive globe, with markers showing cities by relative size.