Spotfire® Enterprise Runtime for R

Calling RGraph to Create an Image File with the TERR RinR Package

The RinR package provides functions that can start other versions of TERR or open-source R. Using the RinR function RGraph, you can create a graph in open-source R, and then just view the graph or save it as an image file to share with others.

About this task

Perform this task from the TERR console.

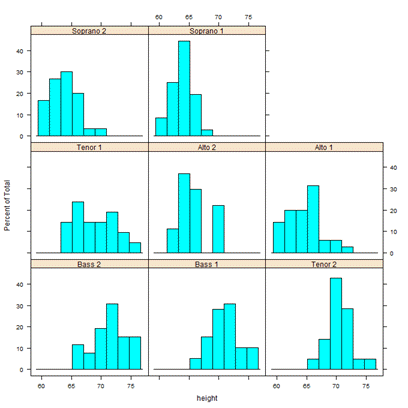
This example walks you through creating lattice graph, saved as an image (.png) file, using data available in the TERR library Sdatasets, and then displaying the results in a browser.

Remember: For information about RinR, load the package and then open the package help.
help(RinR)

Before you begin

You must have open-source R and TERR installed on your computer. For this version of TERR, we tested with open-source R version 4.2.

Procedure

  1. Load the RinR package in TERR.
    library("RinR")
  2. Optional: If necessary, run the RinR function configureREvaluator, passing in the full path to your open-source R installation.
    This step might be required if you have installed open-source R in a non-standard location.
    configureREvaluator(REvaluator, FullPath="C:/R-4.0.0/bin/R")
    1. Run the RinR function REvaluate(version$version.string, REvaluator) to check the results.
      [1] "R version 4.0.0 (2020-04-24)"
  3. Run the RinR function RGraph, passing in arguments to that create the graphic.
    • An expression, that specifies the type of graphic you want to produce. In the example, the example is an open-source R latticed histogram.
    • The data, that is specified in a character vector or in a list. In the example, the data, singer, is from TERR Sdatasets package and is specified in a list.
    • The argument display=TRUE, which opens the graph in your default image viewer.
    h <- RGraph(print(lattice::histogram(~height|voice.part, 
    data=s)), data=list(s=Sdatasets::singer), display=TRUE)
If you want to save the resulting image as a file and share it with others, complete the following steps.
  1. Optional: To save the resulting image as a file and share it with others, call the TERR base package function tempfile to create an object to contain the file extension.
    pngFile <- tempfile(fileext=".png")
  2. Optional: Call the TERR base package function writeBin, passing in the two objects created in steps 3 and 4.
    This step creates the binary file containing the image and specifying the file type.
    writeBin(h, pngFile)
  3. Call the TERR utils package function browseURL, passing in the image file.
    browseURL(pngFile)
    A default image viewer for the file type opens, displaying the image. In this example, the image shows a histogram of singer heights for each voice type in the choir.

Results


lattice graphic example

What to do next

From the TERR console, call the function browseVignettes("RinR") and review the additional examples for using RGraph with TERR.