Application Memory Usage
Application Memory utilization displays the average memory usage distribution of the number of unique applications running over the selected time range. Memory utilization is the ratio of the amount of memory (in unit of bytes) consumed by the main app container over the limit of memory allocated for the container.
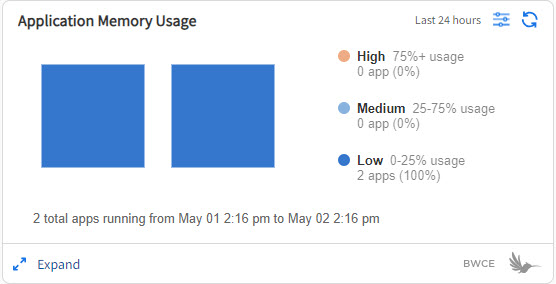
Note: BWCE application currently allocate a limit of 4 GB for the main app engine container in the Kubernetes deployment.
Flogo application currently allocate a limit of 1 GB for the main app engine container in the Kubernetes deployment.
Application Memory Usage Details
The details page provides a graphical view to analyze average memory usage by an application over the period of time.
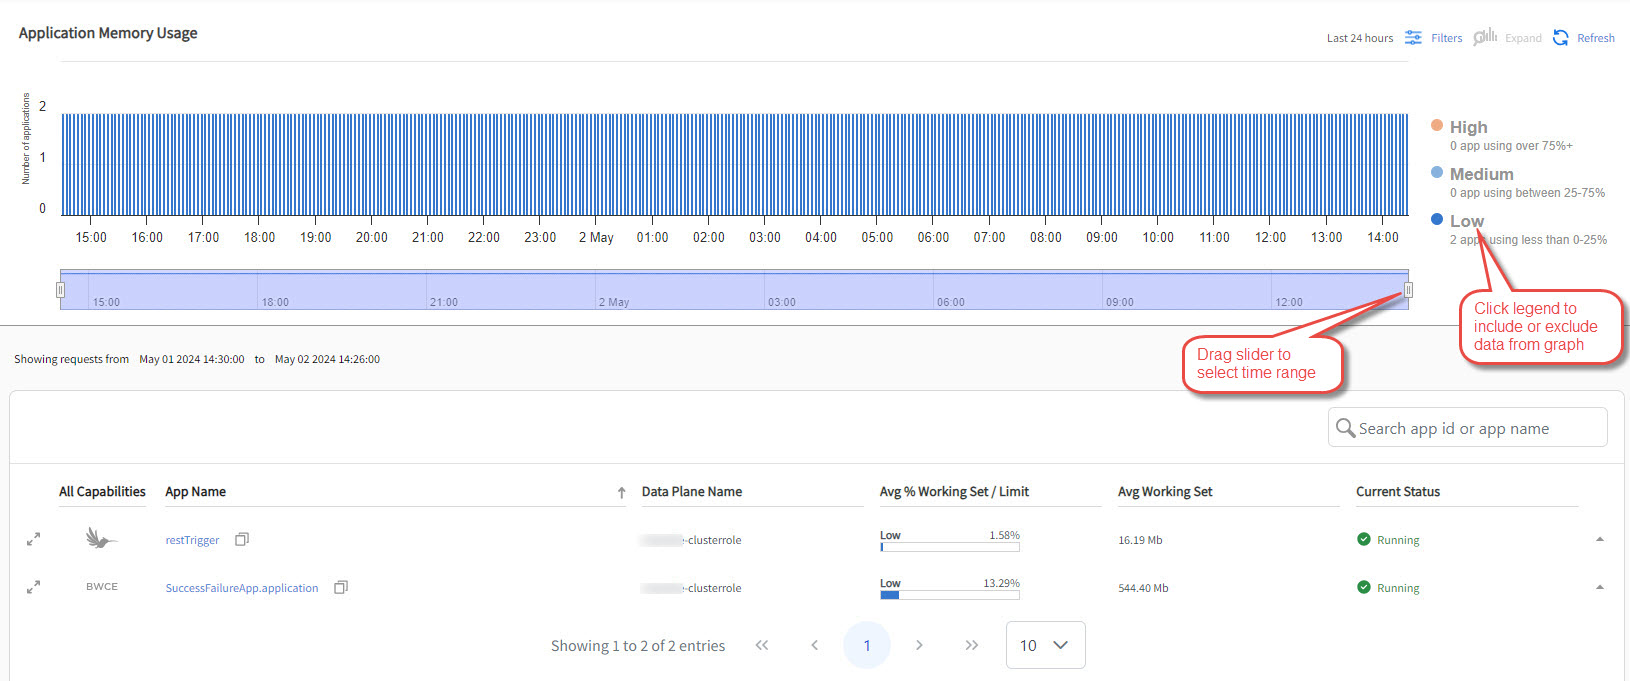
You can view the following information on the Application Memory Usage details page:
| Column | Description |
|---|---|
| All capabilities | Name of capability in which application is deployed |
| App name | Name of the application. Click application name to view app details page in a new window. If you click drop down arrow in the last column, you can view application instances names. |
| Data Plane name | Name of the data plane on which the application is deployed. |
| Average % Working Set / Limit | The average ratio of memory usage over the allocated limit for the app container in the target time range. |
| Avg Working Set | The average amount of memory in use by the App in MB. |
| Current Status | The status column displays the current runtime status of an application. The status is reported by monitor agent. For more information about app status, see Viewing Application Status. |
To view logs and traces, click the Expand ![]() icon in the first column. For more information, see Analyzing Logs and Traces.
icon in the first column. For more information, see Analyzing Logs and Traces.