Control Tower Application Instances
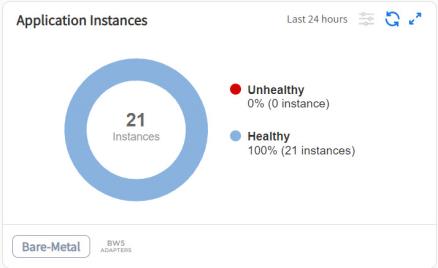
Application Instances card displays the number of running TIBCO ActiveMatrix BusinessWorks™ 5.x applications (Healthy and Unhealthy). If Adapters Service instances are part of a TIBCO ActiveMatrix BusinessWorks™ 5.x application then only a service instance count is added in the total instance count on the Applications Instances card. The application instances data is real time. To view details, click Expand ![]() .
.
Application Instances Details Page
This page provides a graphical view to navigate quickly to the number of user application instances running in the selected time range. You can view the unhealthy incidents captured during the life cycle of the running application instances. The time graph gives an observability of the number of running application instances that have unhealthy incidents recorded in the selected time range. Using the slider, select the time range to narrow down to the exact participating applications in the app list. You can use this detailed dashboard to analyze the cause of unhealthy incidents.
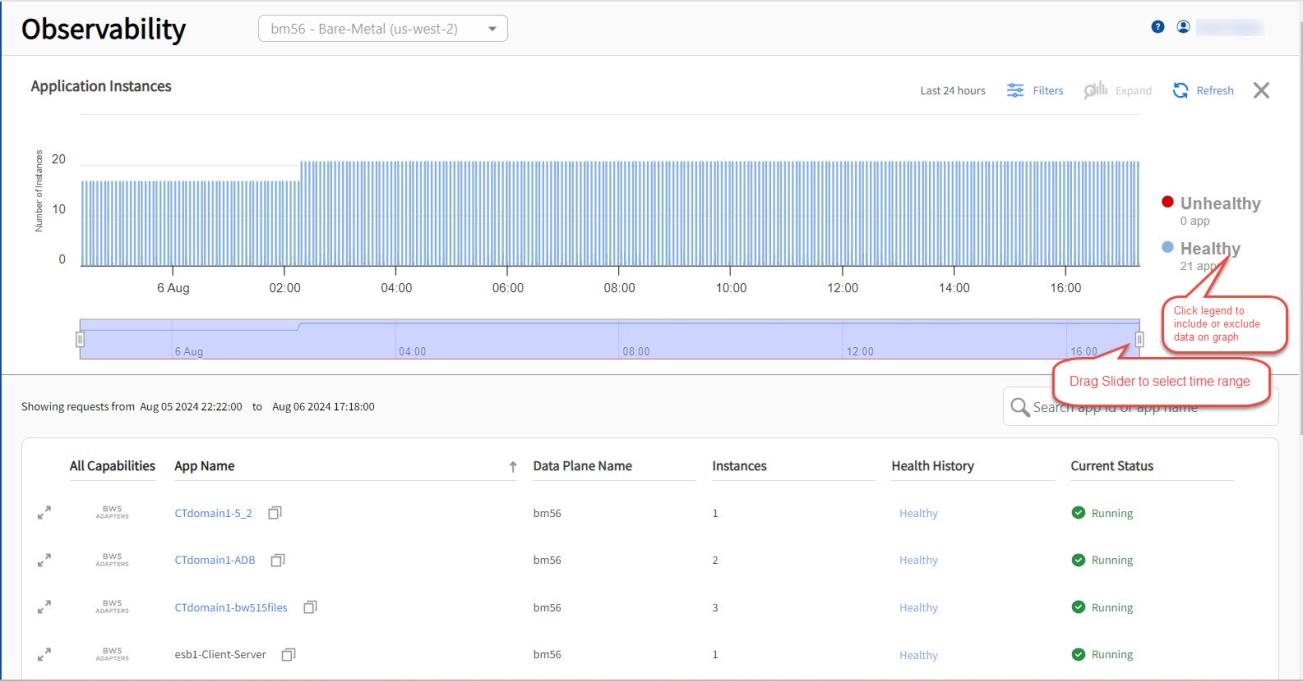
You can view the following information on the Application instances details page. The data displayed in the table is updated based on the time range that you select in the graph. The following table provides the descriptions of the fields.
| Column | Description |
|---|---|
| All Capabilities | Name of the capability in which the application is deployed |
| App Name | Name of the application. Click the application name to view the application details page in a new window. |
| Data Plane name | Name of the data plane on which an application is deployed. |
| Instances | Number of running application instances |
| Health History |
The Health History column displays the health history of an application. Healthy: On the graph, the Healthy count represents the count of running application instances that are running and responding to health checks Unhealthy: On the graph, the Unhealthy count represents the count of running application instances that are running but unable to respond to health checks either temporarily or indefinitely. The app Health History is unhealthy if one or more incidents have happened. |
| Current Status | The status column displays the current runtime status of an application. The status is reported by the monitor agent. For more information about app status, see Viewing Application Status. |
To view the traces, click the Expand![]() icon in the first column. For more information, see Viewing Traces for Control Tower Applications.
icon in the first column. For more information, see Viewing Traces for Control Tower Applications.