Viewing Observability Dashboard
TIBCO Control Plane provides the dashboards such as Request Counts, CPU Utilization, Memory Usage, and Application instances. To view the Observability dashboard, in TIBCO Control Plane, click the Observability menu from the left navigation.
- You must have either Application Manager or View Applications permission to view observability dashboard. for more information, refer Permissions.
Observability dashboard provides a graphical view (in the form of a chart, bar graph) for applications, request counts, CPU utilization, memory usage, and other metrics. You can drill down the charts to view more information. You can customize the Observability dashboard. For more information, see Customizing Observability Dashboard.
You can perform the following tasks on the Dashboard:
-
You can use the data plane filter at the top to filter data for a selected data plane. By default Global Observability Data Planes option is selected. It means data for all the data planes that use the Global Observability resource is displayed. If you have explicitly configured observability resource at the data plane level, those data planes are listed in the filter.
-
To refresh the chart data, click Refresh
 .
. -
To drill down, click Expand
 on the card.
 -
To filter the chart data, click the Filter
 icon. For more information about Filters, see Filtering Observability Data.
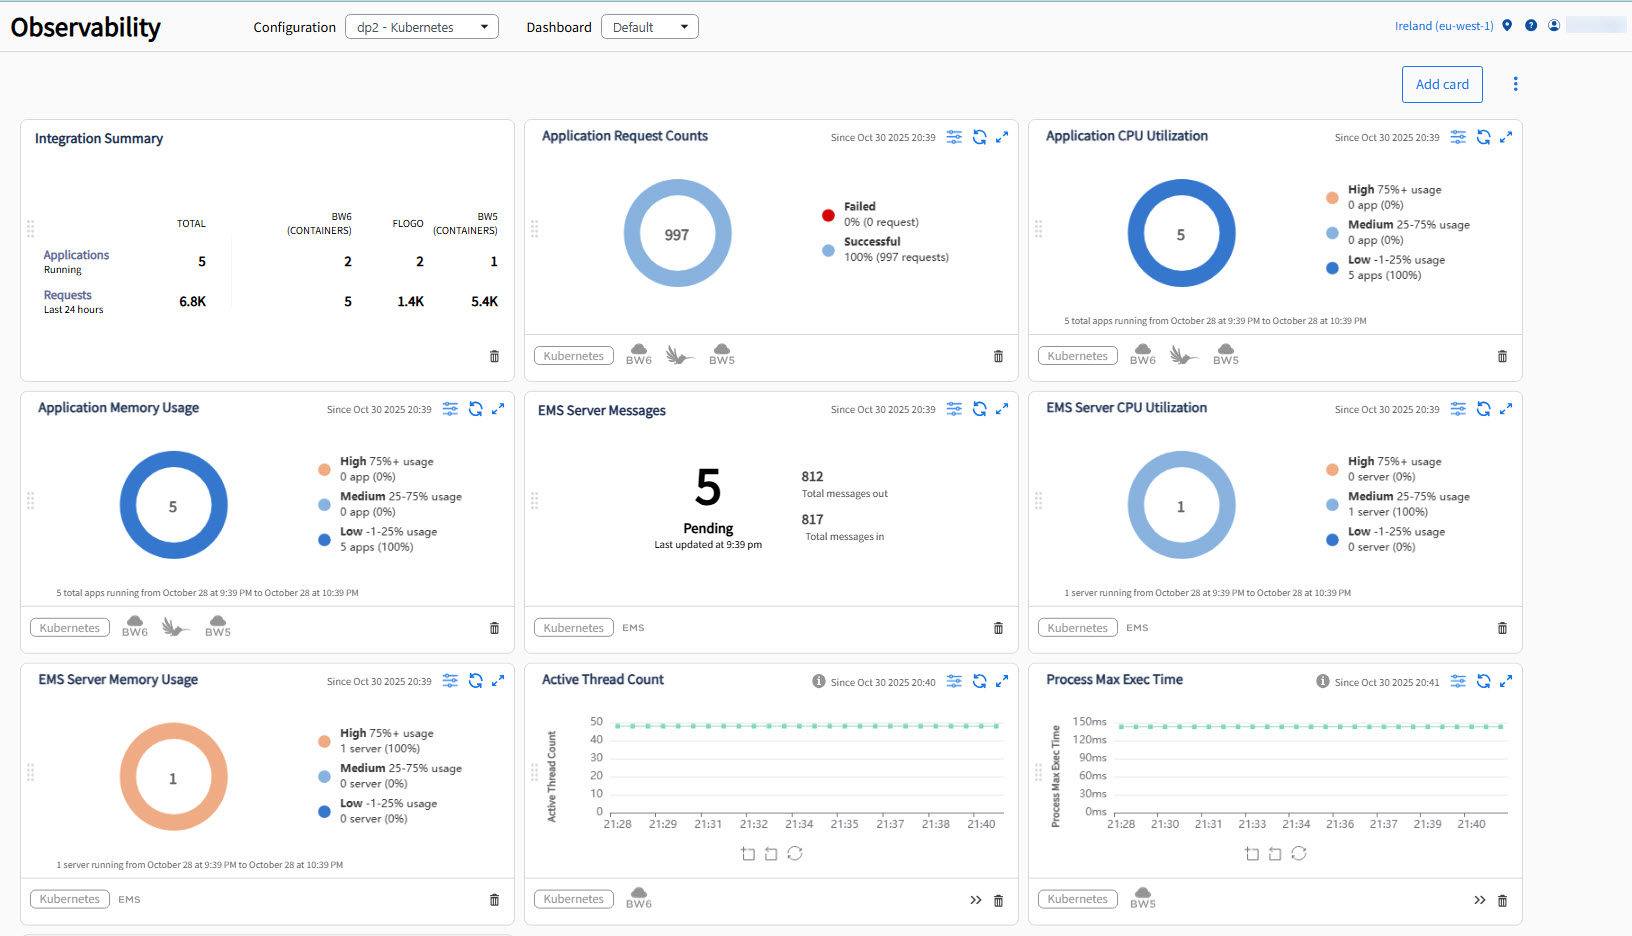
Integration Summary Card
Integration summary cards display the following information:
-
Number of BW6 (Containers) or Flogo apps that are currently running on data planes.
-
Total number of requests processed by the apps in the last 24 hours.