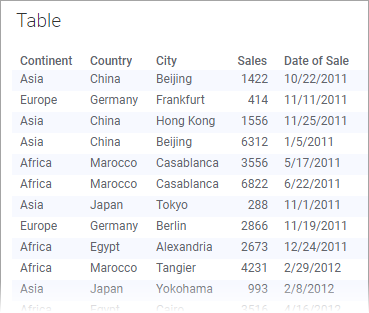
The table in TIBCO Spotfire works much like any other table you might be familiar with. It presents the data as a table of rows and columns, and is used to see details and compare values.
By clicking a row you mark it, and by dragging the mouse pointer over several rows you can mark more than one row.
The appearance of the table can be changed. For example, the order of the columns and their widths can be adjusted, headers can be displayed horizontally or vertically, and the alignment of the texts can be specified.
You can sort the rows in the table according to different columns, or filter out unwanted rows by using the filters.

Tip: Press the Shift key and click on a column header to sort by that column. Press Shift and click again to change sort order. To sort by an additional column, you can press Ctrl+Shift and click on the column header of interest. Press Ctrl+Shift and click again to change sort order.
All visualizations can be set up to show data limited by one or more markings in other visualizations only (details visualizations). Tables can also be limited by one or more filterings. You can also set up a table without any filtering at all. See Limiting What is Shown in Visualizations for more information.
Working with in-database data in table visualizations
When you work with in-database data from relational data sources, the table visualization can only show a limited number of rows. The default value of this limit is 10 000 rows. For data that exceeds this limit, only the first 10 000 rows will be visualized in the table. A Spotfire administrator can configure the row limit on your Spotfire server, by editing the preference TableVisualizationExternalRowLimit in the Administration Manager.
A primary key must be specified to enable highlighting and markings in the table visualization.
Note: For in-db data from cube data sources you need to manually specify which columns to show in the table. Choosing a small number of columns helps reducing the size of the resulting query and improves performance.