On the authoring bar, click
Data canvas ![]() .
.
From the drop-down list in the upper-left part of the Data canvas, select the data table you wish to edit.
Comment: This step is only applicable if you have two or more data tables in the analysis.
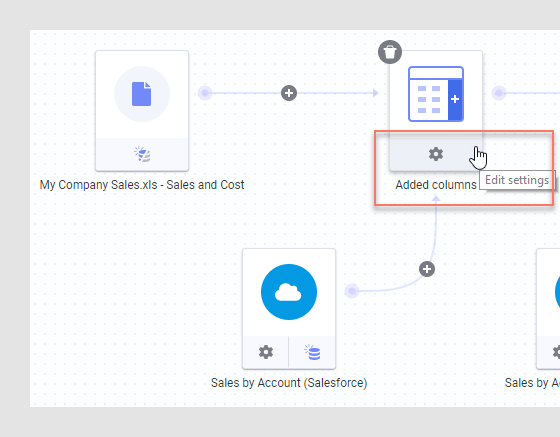
In the graphical structure,
click the settings button on the Added columns
node.

Response: The Settings for added columns dialog shows a preview of the data using the current settings.
Comment: You can change the Number of input rows to include more rows (from both input tables) in the sample calculation. This may increase the accuracy of the shown result. However, using too many rows in the preview can decrease the performance of the preview.
In the Settings for added columns dialog, verify that the column matching is still valid, or edit the matching as desired. This is done by editing, adding or removing matches.
Comment: If an earlier match is broken, an exclamation mark is shown on the row. To edit a match, click on the row with the match and select one column From original data and one From new data. Click on the x on a row to remove a match. You can also add a new match.
Tip: When adding columns, matching is done to enable joining between two data sets. Typically, only one or a few columns containing row identifiers should be used in the match.
Review the columns available under Columns from new data and modify which columns to include or exclude by selecting or clearing the check box for each column.
Comment: Note that if the data source from which columns were added can be reloaded, and new columns become available after a reload, then the new columns will automatically become included. If this was not desired, you may want to exclude new columns after reloading data.
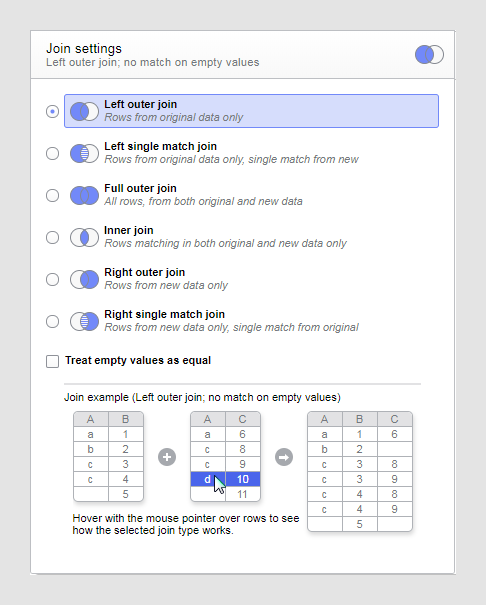
Review the Join settings.
Comment: Look at the interactive Join example, at the bottom of the Join settings field, for information about how rows will be matched using the different join types.
Comment: You can specify whether or not to match on empty values using the Treat empty values as equal check box.
When you are done, click OK.