Replacing a Data Source
More than one data source may have been used to build a
data table. You can replace an individual data source in the source view
of the data canvas, provided that the data table is linked and not top-level
embedded. When you replace the data source rather than the data table,
you keep all applicable transformations, operations and calculations done
after the data was first added. Note that if subsequent transformations
or calculations become invalid due to changes in the structure of the
new source (e.g., different column names), then the resulting data table
might become empty, that is, without any data or columns. It is always
a good idea to review the data canvas after
a replace operation to look for errors or warnings.
Note: You cannot replace an
external data source, nor can you change the type of data from imported
(in-memory) data to external data (in-db). If such a change is necessary,
you must replace the entire data table instead.
When you replace a data source (e.g., from a file data
source to an imported data connection), the data loading behavior will
be switched to the default setting for the selected type of source. For
example, if the old data was stored file data and the new data source
is a password protected file, then the new data loading will default to
'Always new data'. In most cases, the data loading behavior can be changed
by clicking on the bottom part of the source node in the source view,
should the new default not be what you wanted.
To replace a data source:
On the authoring bar, click
Data canvas  .
.
From the drop-down list in the
upper-left part of the Data canvas, select the data table you wish
to replace data in.
Comment: This step is only applicable if you have
two or more data tables in the analysis.
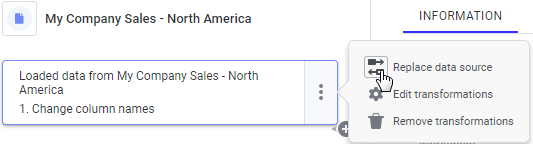
In the graphical structure,
click on the node representing the data to replace.
Response: Details about the selected node are shown
in the bottom left part of the data canvas.
Click on the menu and select
Replace data source.
In the Files and data flyout,
choose a new data source.
Click OK
to close all dialogs and flyouts.
Response: If the new data table contains columns
that match the columns in the old data table completely, the analysis
is immediately updated to use the new data. However, if some columns
used in the analysis could not be replaced automatically by columns
in the new data table, you will be presented with the Replace
Data – Match Columns dialog. Here, you can match columns from
the current data table with columns from the new data table. The data
is replaced, but you may need to make some manual fixes to make sure
all visualizations are displayed as you intended.
If necessary, update any transformations,
visualizations, calculations, or hierarchies that were broken when
the data was replaced.
If desired, modify the data
loading behavior for the new source in the Data
canvas.
Note: When a data connection
is added to the analysis, all views in the connection will be available
within the analysis until the connection or a view is removed using Data
> Data Connection Properties, regardless of whether the view is added
as a data table or not. Therefore, you should select a connection under
Data connections in current analysis to add
more views from an already used connection rather than adding another
connection to the same source. See What
is a Data Connection? for more information.