Introduction for Data Function Authors
Data functions are calculations done by another engine
than the internal Spotfire data engine. Before you start creating your
own data functions, read What
are Data Functions? to understand the different concepts. It is particularly
important that you know the difference between the data function definition
(which includes the script and parameters) and the data function instance
(which is the mapping of the inputs and outputs from the definition, when
the data function is used in a Spotfire analysis).
As a script author, you can create data functions that
other authors in your organization can reuse in their own analyses, by
saving your data function definition to the library. You can help others,
and make sharing more efficient, by writing thorough
descriptions, and by using well-defined parameter names or display
names when you create your data function.
It is also common that data function authors add the data
functions to specific analyses, to help the end users to know how it should
be used, and include the actual mapping for a particular data source or
field of interest.
A common workflow
Create and register the data
function definition. You can start working with the tool of your choice,
but, once your script is defined, use the Register Data Function dialog
to define how parameters should be used in Spotfire.
Save the data function to
the library (when applicable).
Add a data function instance
to an analysis by running it from the  flyout,
the
flyout,
the  flyout or, via Insert in
the Data Function
Properties dialog.
flyout or, via Insert in
the Data Function
Properties dialog.
Comment: This step is needed if you want to add
action controls to text areas in an analysis. It is also possible
to use Run from the Register Data Function
dialog, but note that each time you run the data function, you will
add a new instance of the data function to the document.
Note: Normally, you should
only keep a single instance of the data function in the analysis and
edit the definition for this instance, rather than running the same
data function definition multiple times. Make sure you clean up the
analysis by deleting unnecessary instances from the data canvas or
the Data Function Properties dialog if you happen to add more instances
during developing and testing.
When running the data function,
map the input and output parameters to your current analysis.
If you need to tweak the script
or change the parameters, edit the data function from the Data
Canvas, rather than inserting new instances.
Make sure to save the finished
data function definition to the library, to enable reuse by others.
Script languages
Data functions are often based on R scripts running under
TIBCO Enterprise Runtime for R (TERR), but they can also be based on open-source
R, Python scripts, SAS scripts, MATLAB scripts or S-PLUS.
To use TERR, you can use it either from the engine
provided in your Spotfire installation, or from the TERR service,
installed on a node available to your TIBCO Spotfire Server.
To use Python, you can use either a local installation
of Python or the TIBCO Spotfire Service for Python, installed on a
node available to your TIBCO Spotfire Server. Spotfire Analyst includes
a python.exe but you can also switch to use another installation under
Tools > Options > Data
functions. Read more about how to work with Python in the document
Python
Data Functions in TIBCO Spotfire®.
To use open-source R, you can access it either
from an installation of Spotfire Statistics Services Local Adapter
using a locally-installed R engine, or from an engine that you have
installed that is running under TIBCO Spotfire Statistics Services.
For more information on using R with Spotfire Statistics Services
Local Adapter, see the README file included with the Statistics Services
Local Adapter. (Other third-party calculation tools can be added using
the TIBCO Spotfire API.) For information
on using R with Spotfire Statistics Services, see the TIBCO
Spotfire Statistics Services Installation and Administration Guide.
Note: Open-source R is available under
separate open source software license terms and is not part of TIBCO
Spotfire. As such, open-source R is not within the scope of your license
for TIBCO Spotfire. Open-source R is not supported, maintained, or
warranted in any way by TIBCO Software Inc. Download and use of open-source
R is solely at your own discretion and subject to the free open source
license terms applicable to open-source R.
To use SAS, MATLAB or S-PLUS, you must access these
engines via Spotfire Statistics Services (support for S-PLUS was removed
from Spotfire Statistics Services v. 10.3.0). The SAS or MATLAB engines
can only be accessed if you have a working installation of the
selected software available.
See http://spotfi.re/sr
for information about the TIBCO Spotfire Statistics Services system requirements.
Getting started
You can define an open-source R data function either from
an existing function in the corresponding TIBCO Spotfire Statistics Services
package repository, or by writing a script directly in the Register Data
Functions dialog, and then running using the appropriate engine (for R
functions that would be either the TERR engine or the open-source
R engine). Other types of data functions are always based on scripts.
To ensure a rapid response and a good user experience,
avoid sending very large data sets from Spotfire to a statistical engine,
or invoking complex, long-running calculations.
Tip: You can develop open-source
R or TERR scripts in RStudio, a full-featured, open-source integrated
development environment for working with R code. RStudio is provided independently
of TIBCO Software Inc. You can configure RStudio to use the TERR engine,
and to display its language reference. Also, you can access the TERR language
reference at https://docs.tibco.com/products/tibco-enterprise-runtime-for-r.
Example 1:
A simple conversion of the values in a column from degrees
Celsius to degrees Fahrenheit. Although this is easy to accomplish using
the Add calculated column tool, it serves
as an example simple enough to show input and output parameter handling
in more detail.
To create and run an R script data function in a
TERR Engine:
Assume that the data table
in TIBCO Spotfire contains a column with temperatures expressed in
degrees Celsius.
First, on the menu bar, select
Tools > Register data functions.
For Type,
specify R script - TIBCO Enterprise Runtime for
R from the drop-down list.
Enter a good Description
of the script. For example, "This script converts a temperature
expressed in degrees Celsius to degrees Fahrenheit.".
Comment: The description will be shown in the user
interface when running the data function from the library.
Define the script to perform
the conversion on the Script tab:
# Define the convertTemperature function:
convertTemperature <- function(x)
{
x*(9/5) + 32
}
# Run the function to produce the output:
out <- convertTemperature(x);
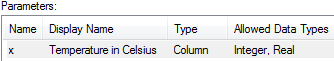
Define the input parameter
x as a column with the allowed
data types Integer and Real.
Tip: You can select the
parameter in the Script tab and use the pop-up menu option Input
Parameter to reach the Input Parameter dialog directly.
Also remember that any description that you add here can help others
making good selections when running or editing the data function later
on.
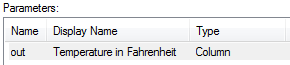
Define the output parameter
out as a column.
Tip: You can select the
parameter in the Script tab and use the pop-up menu option Output
Parameter to reach the Output Parameter dialog directly.
Note that the output display name will not be propagated
to the output column name. The column name is always the output specified
by the R script.
Save the data function to
the library, as Temperature converter.
To run the calculation and
to connect the input and output parameters to your current data in
TIBCO Spotfire, on the authoring bar, click Files
and data  and locate
the data function of interest by searching for the title or a suitable
keyword.
and locate
the data function of interest by searching for the title or a suitable
keyword.
Note: Each time you
run a data function, a new instance is created in the document. If
you later want to test the data function with other inputs or outputs,
edit the instance from the Data canvas instead of running it again.
Comment: To locate all data functions in the library, enter type:datafunction
in the search field. You can also add a part of the name to find a
specific data function. To be able to add data functions that require
a data table or column input, you must first have some data loaded
in the analysis.
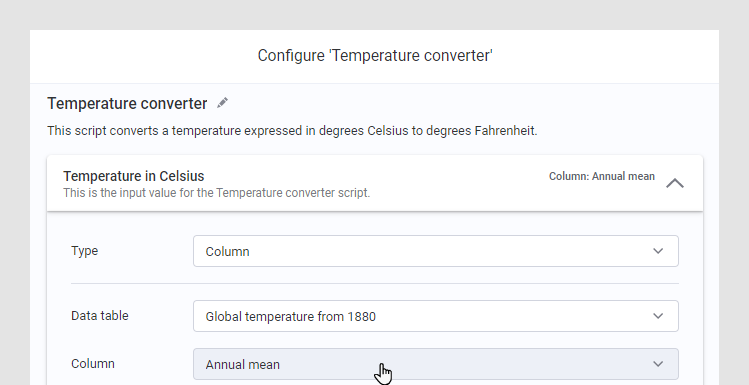
Specify that the input parameter
x should be a column
and select the data table and column to convert. Note that descriptions
you enter for the data function itself as well as for input and output
values show up in the user interface when running the data function.
Click OK.
In the summary view, select
how to add the new data; as a new data table or as a new column in
an existing data table, and click OK when
you are done.
The data function calculation is performed and a new column
is added as specified. You can change the parameter settings or refresh
the calculation later by locating the data function in the Data
Canvas or by selecting Data > Data functions
properties.
Example 2:
If the function to use is a Principal Component Analysis
(PCA) calculation, the input would be a number of numerical data columns
retrieved from the current data in TIBCO Spotfire and, optionally, a parameter
specifying the percent variation to be preserved by the principal components.
The output would include three new data tables (scores, loadings and eigenvalue/explained
variance table) and a scalar indicating the number of principal components
generated.