Adding a streaming time range to a visualization
When you are working with streaming data and you want to limit the data in the visualization to a certain time range, you can add a Streaming time range limitation. This way, you can choose to only show data from the latest 5 minutes (or similar).
About this task
Tip: You can specify a time range directly on a time axis
in a visualization. Just click on the axis to open a popup menu.
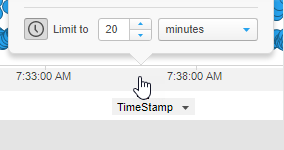
For more options to specify the time range, use the Visualization properties.
Procedure
-
In the
Limit streaming data to a time range dialog,
configure the time range as desired.
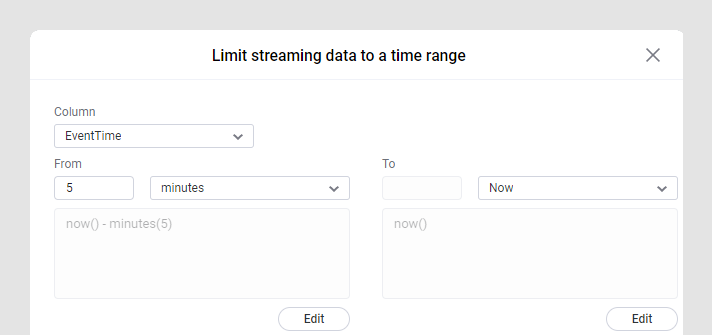
Option Description Column Select the DateTimecolumn you want to use when specifying a time range.From Specify a starting point for the time range by selecting a number and a time unit. To Specify an end point for the time range by selecting a number and a time unit. Edit Click Edit to open the Limit Data Using Expression dialog (installed client), or the Custom expression dialog (in web clients), where you can write your own expression to specify a starting point or an end point for the time range.