Adding data limitations for a visualization
The default behavior when adding a new visualization is that it is automatically updated with the filtering on the page. However, it is possible to change the data limiting so the visualization is not changed by filtering at all, or so that it uses another filtering scheme. You can also make the visualization respond to one or more markings in other visualizations (often called details visualizations). Other options to limit the data is by using expressions, or, for streaming data, by specifying time ranges. You can change the data limitation settings under Data in the Visualization properties.
Procedure
-
Under
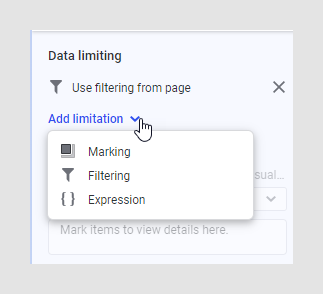
Data limiting, click
Add limitation and choose which type of
limitation to use.
Option Description Marking Choose one or more of the available markings to limit what is shown in the visualization. This means that the visualization only shows data that has been marked in other visualizations (main visualizations), or has been marked within the visualization itself. If more than one limiting marking is selected, you can choose how the data in the markings should be combined in the popover next to Settings for limiting markings. Use All markings (AND) to show the intersection of markings, and Any marking (OR) to show the union of the selected markings.- All markings (AND) – Use this if you have two main visualizations with different markings and want to see which markers are present in both markings. This visualization will then show only the data that has been marked using both of the selected markings.
- Any marking (OR) – Use this if you have two main visualizations with different markings and want to see which markers are present in either of the two markings. This visualization will then show data that has been marked using either of the selected markings.
Tip: You can specify what should be shown in the visualization if no items have been marked in the main visualizations using the If no items are marked in the limiting visualizations, show drop-down list. For example, you can add a message with instructions.If you want to be able to mark data and show it within the visualization itself, the All data option must be selected in this list.
See Drilling down into details to learn more about how you can use details visualizations to drill down into your data.
Filtering Defines how different filtering schemes in the analysis should affect this visualization. Select Use the current filtering from the page if you want the visualization to always respond to the filtering scheme that is used on the page where the visualization is located. If you move the visualization to a new page, then the visualization will automatically start reacting on the filtering scheme that is used on the new page.
Select a specific filtering scheme from the list if you want the visualization to always use that filtering scheme. Moving the visualization to another page with a different filtering scheme will not affect this setting.
If you choose to limit data using more than one filtering scheme, the intersection of the filterings will be used. This means that the visualization will show only the data that is kept visible by all of the filtering schemes.
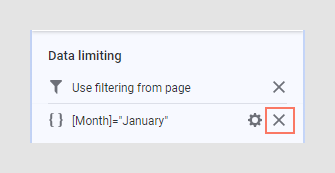
Expression You can limit what data should be available for a certain visualization using an expression. If you have defined a limiting expression, it will be shown in the Data limiting list. Streaming data time range This option is available if the visualization is configured with a data table containing streaming data. Select this option to show data from a limited time window.
The time range could be very short, for example containing data from the last 5 seconds, or much longer, for example containing data from the last week or month.
Tip: You can specify a time range directly on a time axis in a visualization. Just click on the axis to open a popup menu.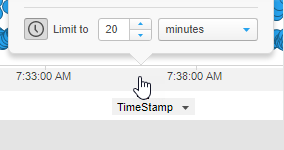
Results