Drilling down into details
If you want to drill down into specific data in a visualization, you can create a details visualization of a suitable type and configure it to your needs. In the main visualization, you mark the data that you want detailed information about, and in the created details visualization, solely the currently marked data will be shown.
About this task
Note: Details
visualizations can be used to drill down into your data in multiple steps. The
marking you perform in one visualization determines what you will see in the
next visualization, and so on.
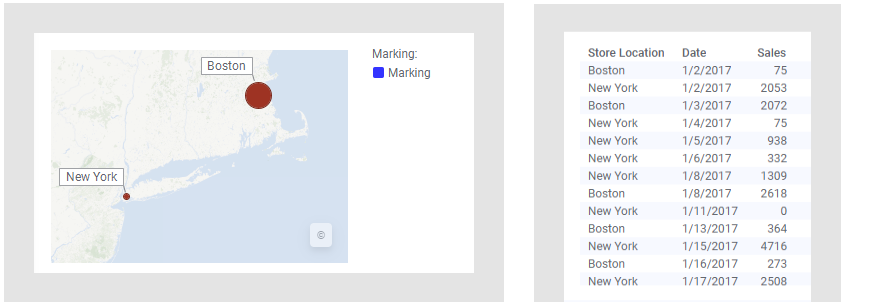
The map chart below is used to illustrate. The markers represent the
total sum of sales at two different stores after the first six months of 2017.
However, the data table, which the map chart is based on, contains more
information, so it is possible to drill down into details. Assume, for example,
you are interested in showing the monthly sales at the Boston store.
This can be done by creating a details visualization. The line chart
below is such a visualization, but any visualization type can be created. By
marking the
Boston marker in the map chart (the main visualization in this example), the
monthly sums for the Boston store are shown in the line chart. If you click on
another marker in the map chart, like New York, you will instead see the
details for New York in the details visualization.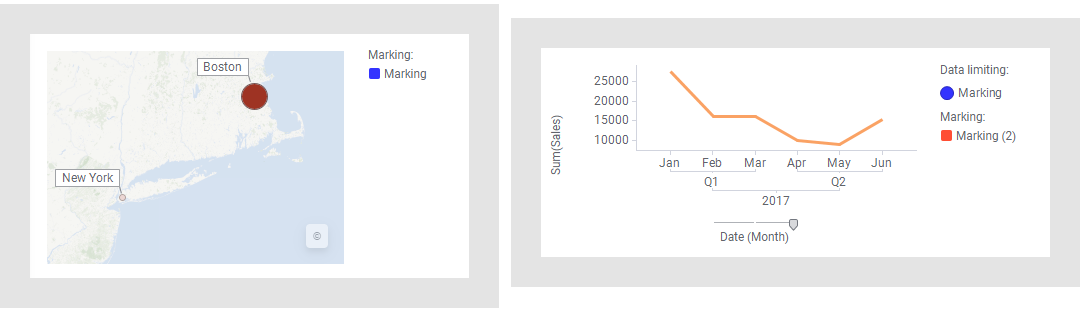
Note: The
Data limiting setting in the legend shows that
the data in the created details visualization is limited by a marking. The line
chart above will only show data that is marked in the map chart using this
particular
marking.
Furthermore, a new marking becomes available in the details visualization. This
marking will be used to limit the data, if you drill down deeper into the data,
using another details visualization. You can read more about data limitations
under
Adding data limitations for a visualization.
Tip: It is
also possible to view marked data within the main visualization itself. See
Zooming into visualization details.
Before you begin
Procedure
-
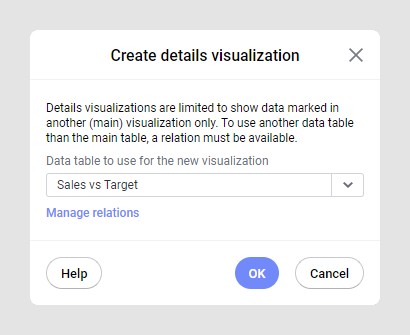
Right-click the visualization, select
Create details visualization and the
visualization type to use as details visualization.
If there is more than one data table in the analysis, and at least two of the data tables have a relation defined, you can choose to use either the same data table as the one used in the main visualization, or a related data table, for the details visualization. You can also click Manage relations to go to the Relations overview in the data canvas.
If
you want to drill down deeper and deeper into your data, you can create
consecutive details visualizations.