Adding prompts to a Salesforce connection
When you create an analysis from Salesforce data, you can configure the analysis to let users select what data to load when opening the analysis.
About this task
Note: Prompts cannot be
added to Salesforce reports, only to tables.
Before you begin
Procedure
-
Click on the icon next to the column name,
 .
.
Input types
When you configure prompts for a column, you need to decide how to
select values from the column.
- Use Single selection to only allow selection of one value from the column.
- Use Multiple selection to allow selection of more than one value from the column. The person using the connection will be presented with a list showing all the available values in the column. You can also specify how many values should be selected, using the Min and Max fields.
- Use Range to allow selection of multiple values between two values. The range option is most suitable for dates and columns containing numerical values. Note that if you use range as input type for categorical values, you must make sure you write good instructions in the Description field.
- Use Manual input to let the person using the connection enter any value to include (for string columns or numeric columns). This input type should only be used if all end users know which values are valid for the column, or if applicable values are shown in the description. For boolean values you get to pick a value using radio buttons (True/False) and for date columns you can choose a date from a calendar.
Input order
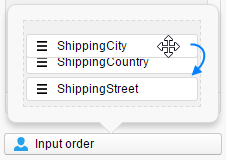
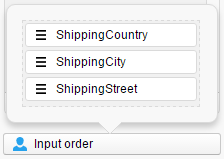
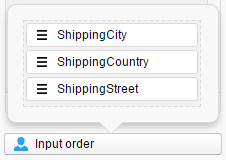
In this example, three columns have been configured with prompts: ShippingStreet, ShippingCity, and ShippingCountry.
The Input order pop-over shows the following order: ShippingCity, ShippingCountry, ShippingStreet.
A better order would probably be ShippingCountry, ShippingCity, ShippingStreet. That way the user would first specify which shipping countries to load data for. The next prompt would show only cities located in the selected countries. And the last prompt would show streets located in the selected cities. To change the order, click on a column and drag it to the position you prefer.