Exploring data across visualizations
In an analysis, marking items in one visualization spreads to other visualizations based on the same data table. This way you can explore the same data in different contexts.
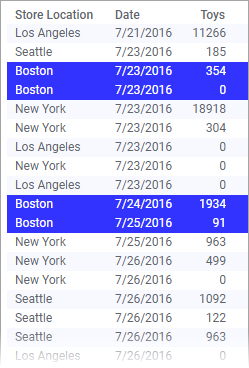
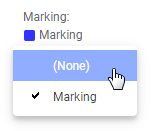
When you mark items in a visualization, you in fact mark the underlying data, that is, the data rows on which the marked items are based. The marked rows are associated with a specific marking, defined by a name and a color.
Other visualizations that include any of these marked rows are also affected. If any marked data row is part of an item in another visualization, this item also becomes marked. There is one condition though: to interplay, the visualizations must have the same marking applied.
This interplay between visualizations can be used to follow up your marked data in another context.
Example
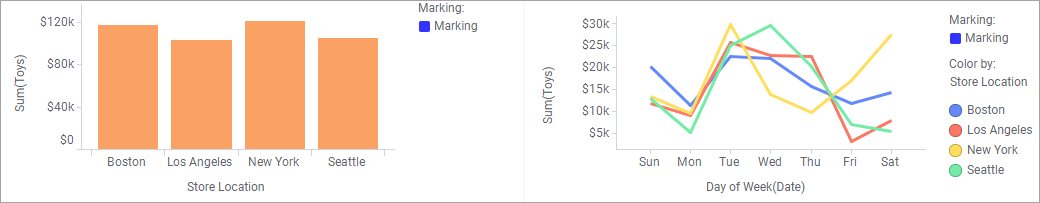
If you mark any of the bars in the bar chart, corresponding line in the line chart becomes marked simultaneously.
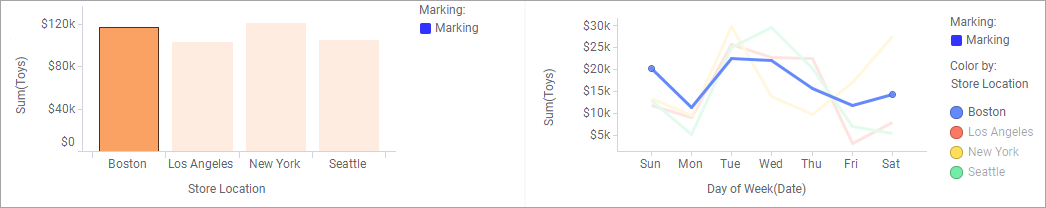
Moreover, you can easily switch between the store locations. Mark another bar, and corresponding line gets marked, alternatively mark another line, and corresponding bar gets marked.