Marking items
You can mark items in a visualization to view details for the items or to clarify connections between visualizations. Marking, for example, a pie sector or a bar is equivalent to marking all the data rows that are included in that pie sector or bar.
The following actions result in marked items:
- Click an item
– marks the item and unmarks previously marked items
- Press Ctrl + click an item
– adds or subtracts items from the marked set of rows
- Drag a rectangle
– marks all items within the rectangle and unmarks all other items
- Press Ctrl + drag rectangle
– adds items within the rectangle that are not already marked to marked items
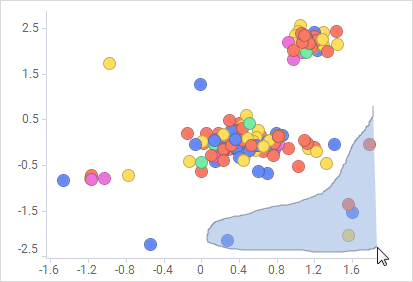
- Press Alt + draw a shape of
any form (lasso marking)
– marks all items within the shape
- Press Ctrl + Alt + draw a
shape of any form
– toggles items within the shape to the opposite of marked/unmarked
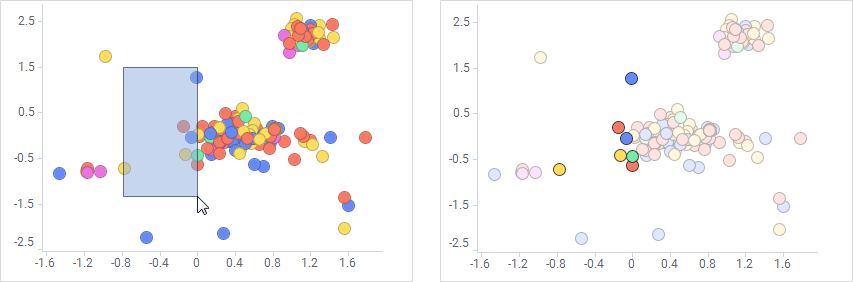
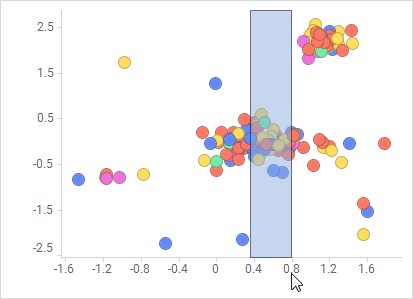
- Click the scale label area
and drag along any of the axes
– marks all items between the two axis values
Note: Marking along the Y-axis in the bar chart is slightly different than normal rectangle marking; Only those bars with the top part of the bar included within the axis marking rectangle will be marked. This allows you to select bars with heights within a specific span.
- Select categories in the
legend
– marks all items of a certain category. For more information, see Marking items using the legend.