Filtering data using the Data in analysis flyout
In your analysis, you can filter to data in which you are particularly interested and filter out the rest. The filtering can be handled from the Data in analysis flyout.
About this task
Before you begin
The Data in analysis flyout is open.
Procedure
-
In the flyout, move the cursor over the column containing the
values you want to filter out, and click
Show filter
 .
Note: If you are working with in-database tables, filters might not have been created yet. Use the Click to create a filter button to create one. When working with cube data it is not possible to create filters for measures or sets, only for dimension columns. This is because the cube calculates the measures in the context of the selected dimensions.Note: Creating filters can take some time, depending on the database used.The filter associated with the column opens. One type of filter is shown below.
.
Note: If you are working with in-database tables, filters might not have been created yet. Use the Click to create a filter button to create one. When working with cube data it is not possible to create filters for measures or sets, only for dimension columns. This is because the cube calculates the measures in the context of the selected dimensions.Note: Creating filters can take some time, depending on the database used.The filter associated with the column opens. One type of filter is shown below.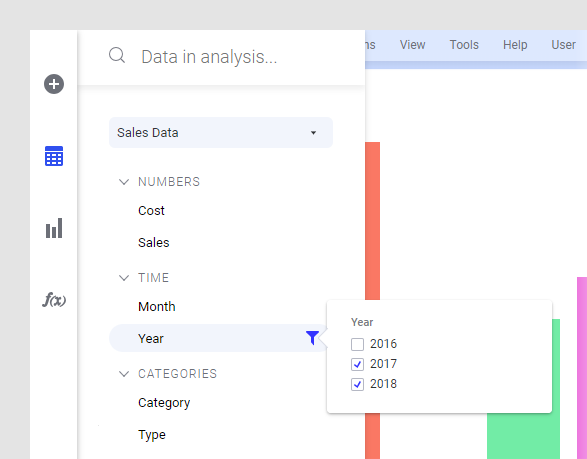
-
Repeat from step 2 to filter data in another column.
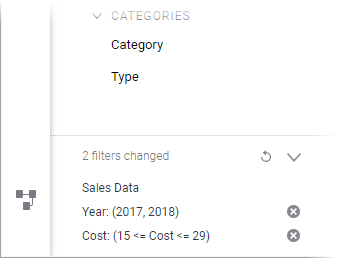
Information about which columns have been filtered, and to which values, is available at the bottom of the flyout. If you want to modify the filtered data, you can open the filter from here by simply clicking it.
Click the
 button to reset separate filters,
and the
button to reset separate filters,
and the
 button to reset all filters.
To collapse the filter details, click the
button to reset all filters.
To collapse the filter details, click the button.
Note: Any filtering action in the Data in analysis flyout also updates the filters in the Filters panel.
button.
Note: Any filtering action in the Data in analysis flyout also updates the filters in the Filters panel.
Example
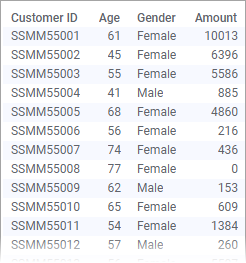
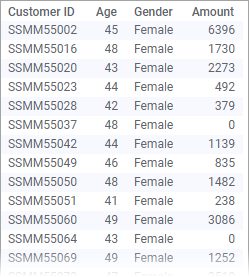
The data table below lists how much money each customer spent last
time they visited a store. Also the customer's age and gender are registered.
What if you are interested in only showing purchases made by female customers between 40 and 50? Simply filter to these particular values using the Data in analysis flyout as shown below.
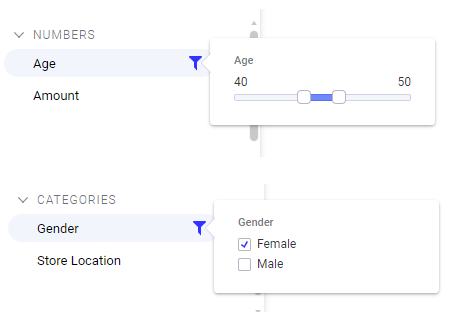
The data table, and every visualization based on it, will adjust to visualize only this limited part of the loaded data.
What if you are interested in only showing purchases made by female customers between 40 and 50? Simply filter to these particular values using the Data in analysis flyout as shown below.
The data table, and every visualization based on it, will adjust to visualize only this limited part of the loaded data.