Filtering data using the Filters panel
In your analysis, you can filter to data in which you are particularly interested and filter out the rest. The filtering can be handled from the Filters panel.
About this task
Note: When you work with
in-database data tables, the filters panel will initially be empty. If this is
the case, you must create the filters you want to use.
 , then
Click to create a filter. When working with cube
data it is not possible to create filters for measures or sets, only for
dimension columns.
, then
Click to create a filter. When working with cube
data it is not possible to create filters for measures or sets, only for
dimension columns.
To create a filter for a column in an in-database data table, move the cursor over the column in the Data in analysis flyout, and click Show filter
, then
Click to create a filter. When working with cube
data it is not possible to create filters for measures or sets, only for
dimension columns.
Procedure
-
If the
Filters panel is not visible, click
Filters
 on the menu bar.
In the panel, you find filters associated with the columns in your data table. The example below shows two types of filters, check box filters and range filters.
on the menu bar.
In the panel, you find filters associated with the columns in your data table. The example below shows two types of filters, check box filters and range filters.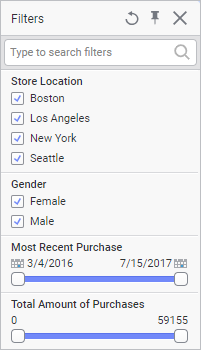
-
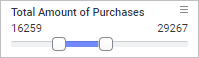
Use its filter to specify which column values to keep and which
values to filter out.
An example of a filtered column is shown below.
-
Repeat from step 2 to filter data in another column.
Information about which columns have been filtered, and to which values, is available at the bottom of the Filters panel. If you want to modify what has been filtered in a filter, you can open the filter also from there by simply clicking it.
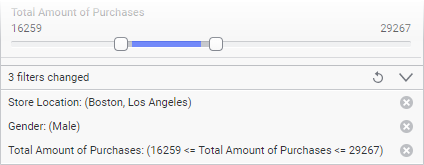
Above the expanded view is shown. To collapse the filter details, click the
 button.
The filtering made can be reset. Click the
button.
The filtering made can be reset. Click the button to reset
separate filters, or the
button to reset
separate filters, or the
 button to reset all filters.
Note: Any filtering action in the Filters panel also updates the filters in the Data in analysis flyout.
button to reset all filters.
Note: Any filtering action in the Filters panel also updates the filters in the Data in analysis flyout.