Guia do Usuário do Cliente Web Spotfire®

Replacing a data table

You can replace a data table in your analysis with data files that are saved locally on your computer, data that has been previously saved to the library, or, if you have access, you can use data from available data connections.

About this task

It is possible to reuse the visualizations, calculations and setup from a previously created analysis with new data, as long as the new data is reasonably similar to the old data. If the new data differs much from the previous data you might need to recreate new visualizations from scratch.

When you replace the data table, only the operations done on the final data table (such as added calculated columns, data types changed from the column view, etc.) will be kept, whereas transformations, added rows or columns, and other intermediate operations will disappear.
Note: If you want to keep transformations, added data and other intermediate operations (all steps between the first added data source and the final data table in the source view), you should consider replacing the data source instead of replacing the entire data table.

Local data files to be used can be in different formats: Microsoft Excel Workbooks (.xlsx, .xls), Microsoft Excel Binary Workbooks (.xlsb), Microsoft Excel Macro-Enabled Workbooks (.xlsm), comma separated values files (.csv), text files (.txt), logfiles (.log), Spotfire Text Data Format file (.stdf) and Spotfire Binary Data Format file (.sbdf).

Data can be saved to the library using Spotfire Analyst, in the form of Spotfire Binary Data Format files (.sbdf), data connections, or information links.

Before you begin

You must have some data loaded in the analysis, and the analysis must be in Editing mode.

Procedure

  1. On the authoring bar, click Data canvas .
  2. Make sure the data table of interest is selected.
    This step is only applicable if you have two or more data tables in the analysis.
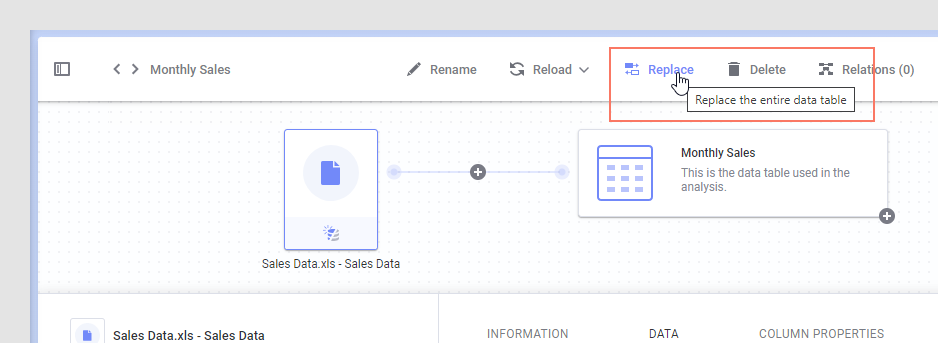
  3. On the data canvas toolbar, click Replace .
  4. In the Files and data flyout, select the new source data. Click OK when you are satisfied.
    Depending on the selected source type, you might be able to change the load method before clicking OK (choose between Import (in-memory analysis) or External (in-db analysis)).
    Note: When a data connection is added to the analysis, all views in the connection are available within the analysis until the connection or a view is removed using Data > Data Connection Properties (installed client only), regardless of whether the view is added as a data table or not. Therefore, you should select a connection under Data connections in current analysis (in the Files and data flyout, under Recommended) to add more views from an already used connection, rather than adding another connection to the same source.
    The data source is replaced with new data.

    If some used columns cannot be replaced automatically by columns in the new data table, you are sometimes presented with a dialog where you can match columns from the current data table with columns from the new data table (installed client only). Manual updates might still be needed.

  5. If necessary, update any visualizations, calculations, or hierarchies that were broken when the data was replaced.
    Note: If you replace a data table used in expressions containing preprocessor syntax, all such expressions must be manually updated to continue working. See Properties in expressions and Troubleshooting property expressions for more information.

Results

The analysis uses data from the new data source.

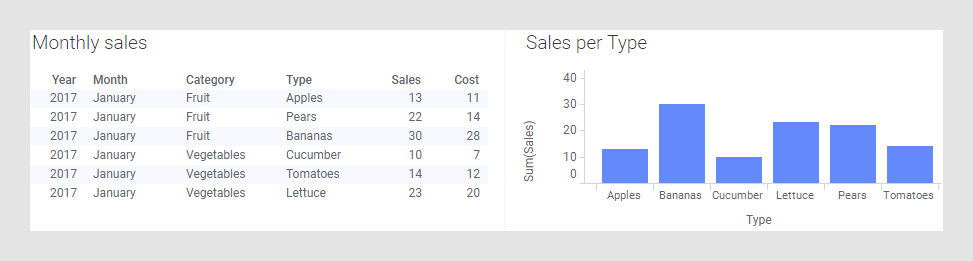
Example: Replacing sales data for a new month

Replacing is useful when creating an analysis for, say, sales figures for a certain month. You can create a full analysis using the data from January, set up visualizations, calculations, etc., and save the file.


Sales data for January

When the sales figures for February are available, you can open the same file again, and, in the Data canvas, replace the data from January with the data from February, and the visualizations will be updated.


Expanded data table button and replace data button.

Select from where to fetch the new data.

Select source.

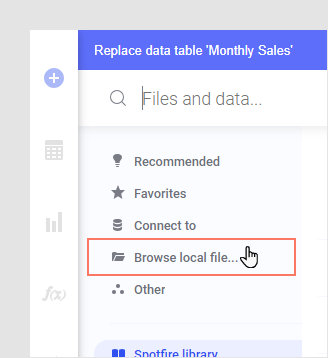
If you use a local file, such as a Microsoft Excel Workbook, you might need to specify which worksheet to use before the data is replaced.


Sales data for February.

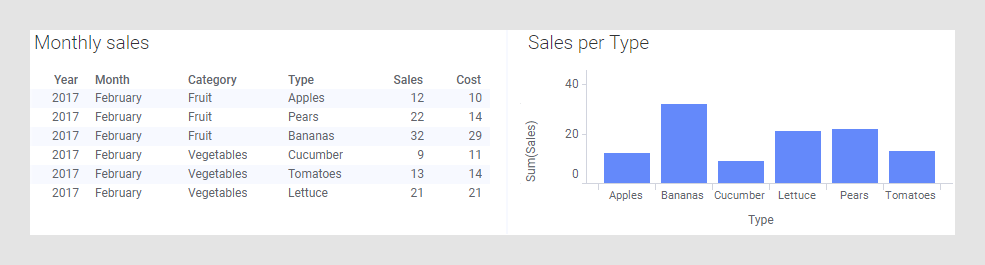
This of course requires that the data table for February is structured in the same way as for January, using the same column names and format. If the column names should differ, you must modify the visualizations to use the new column names after the data has been replaced.