Replacing a data source
A data table can be based on data from one or more data sources. You can replace an individual data source in the data canvas if the data table is linked and not top-level embedded. This is often preferred over replacing the entire data table.
About this task
It is possible to reuse the visualizations, calculations and setup from a previously created analysis with new data, as long as the new data is reasonably similar to the old data.
By replacing a data source, rather than replacing the entire data table, you can keep the data table intact. That means that all transformations, calculations, added rows or columns, and operations that were used to build the final data table are kept as is. Use these steps to switch from a test database to a production database, or when your data remains exactly the same but is moved from one type of data source to another.
Note that if subsequent transformations or calculations become invalid due to changes in the structure of the new source (e.g., different column names), then the resulting data table might become empty, that is, without any data or columns. It is always a good idea to review the data canvas after a replace operation to look for errors or warnings.
When you replace a data source (e.g., from a local file data source to a source file in the library), the data loading behavior will be switched to the default setting for the selected type of source. In most cases, the data loading behavior can be changed by clicking on the bottom part of the source node in the source view, should the new default not be what you wanted.
Before you begin
Procedure
-
On the
authoring bar, click
Data canvas
 .
.
-
In the data canvas, click on the node representing the data
source to replace.
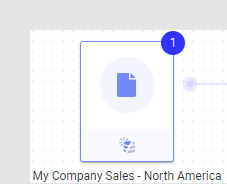 Details about the selected node are shown in the bottom left part of the data canvas.
 -
Locate the 'Loaded data' step and click
Replace data source
 .
If transformations are available, you must first click the menu on the Loaded data step, before you can choose the replace option.
.
If transformations are available, you must first click the menu on the Loaded data step, before you can choose the replace option.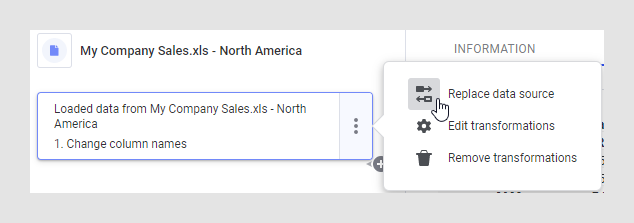
(Edititing transformations is available in the installed client only.)
Results
Example: Switching from a local data source to a Salesforce connection
In this example, someone has configured an analysis with good visualizations using local data from Excel, and you want to replace the data with fresh data using your Salesforce account.
Make sure the analysis is in
Editing mode and, on the authoring bar, click
Data canvas
 .
.
Click on the interesting node.
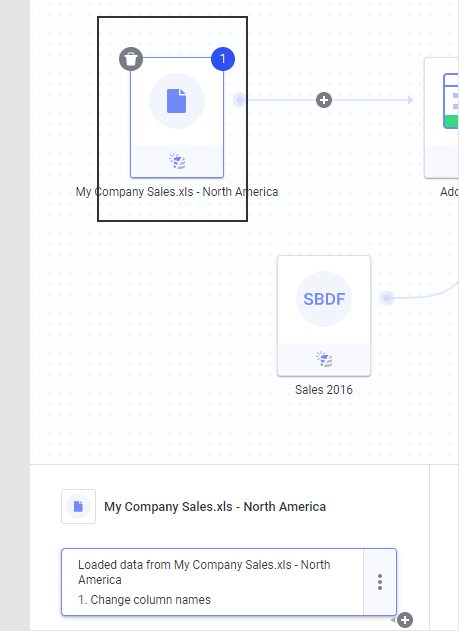
In the lower part of the data source, click
Replace data source
![]() next to the 'Loaded data'
step. If a transformation is available you must first click the menu to see the
option.
next to the 'Loaded data'
step. If a transformation is available you must first click the menu to see the
option.
In the Files and data flyout, select the new data by creating a new connection or using a predefined connection to the new data source (Salesforce), logging in, and browsing to the interesting data. See Creating a new analysis from Salesforce data for details.
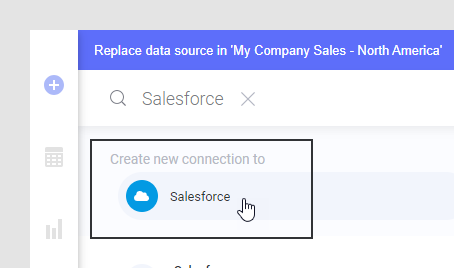
Click OK to load the new data.
In this example, the old transformation used on the previous data source was kept when the data source was replaced.
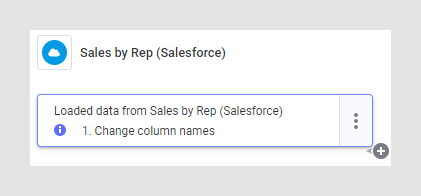
Also note that the data loading behavior has changed from the previously specified 'New data when possible' to 'Always new data', which is the default data loading behavior for a data connection:
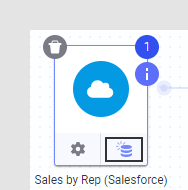
As it turns out, the transformation is no longer needed, as indicated by the tooltip on the information icon, and it can easily be removed:
(The Remove icon will not be available if you cannot reload the source, that is, you must log in to the new source to be able to remove the transformation.)
The data has now been replaced and the analysis is ready to be used.