Guia do Usuário do Cliente Web Spotfire®

Zooming into visualization details

You can zoom into visualization details by marking data of interest and view solely the marked data within the visualization.

About this task

For a more complete drill-down into the data, see Drilling down into details.

Procedure

  1. In the visualization properties for the visualization of interest, locate the Data section.
  2. Below Data limiting, make sure the visualization's own marking is selected (the marking that is selected in the Marking drop-down list in the legend).
  3. Under If no items are marked in the limiting visualizations, show, select All data.
    Now you can mark data in the visualization, and the visualization will adapt to show solely the marked data. To return to the original visualization, simply click an empty visualization area.

Example

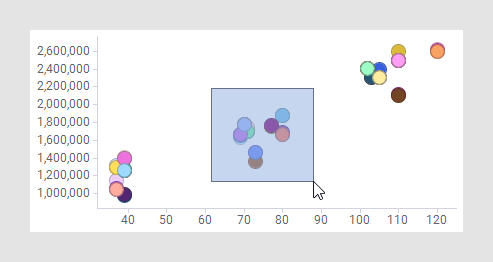
Assume you want to take a closer look at the group of markers in the middle part of the scatter plot below. Follow the steps above, and mark the data of interest.

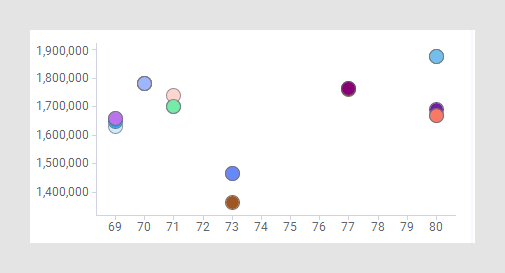
These steps let you zoom into this particular data as shown below.