The data that is to be loaded on demand can be controlled
in a number of ways. See Loading
Data on Demand for more information. The example below uses a property
control in a text area to select which data to display in a bar chart
based on an on-demand data table.
In this example, we first assume that we have a data table
containing a string column called "Type" which lists a number
of different product types loaded in the analysis. We also assume that
there is a data connection with some additional data available, which
also contains a "Type" column. See Adding
Data Connections to an Analysis or How
to Work with Data Connections and their Data Sources in the Library
for more information about connections.
On the authoring bar, click
Files and data  .
.
In the Files and data flyout,
locate the data source (an
information link or a data connection) of interest
by searching for a suitable keyword or by browsing the different categories.
In this example, we use a
data connection.
When you have selected your
data, you will see a summary view showing how the information link
will be added; the Add data to analysis
summary. Click on the new data to enable editing of the settings.
Make sure that the new data is added as a new data table, if this
is what you want.
From the drop-down list, showing
Import or External, select On-demand.
Click Configure.
Response: The On-Demand
Settings dialog is displayed.
In the Define
input for parameters that should control loading list, click
to select the column containing the product types ("Type").
Click Define
Input.
Response: The Define
Input dialog is displayed.
In the Input
for the selected parameter list, select Values
(fixed/properties/expression).
Click the Property
radio button.
Click Select.
Response: The Select
Property dialog is displayed.
If no suitable property is
available, click New in the Document Properties
tab.
Response: The New Property dialog is displayed.
Define a string property using
one of the available product types as default value. For example,
create a string property called "Type" with the value "Apples".
Click OK
in all dialogs.
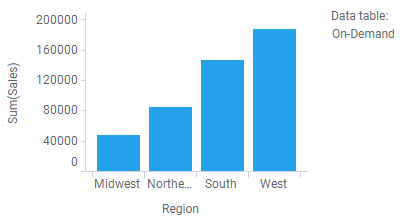
Response: The on-demand data table is loaded
using the limiting default value and can be used in visualizations.
In the example below, the visualization shown is a bar chart displaying
the sum of sales for Apples in four different regions.
Create or activate a text
area.
On the title bar of the text
area (or in the right-click menu) click Edit
Text Area  .
.
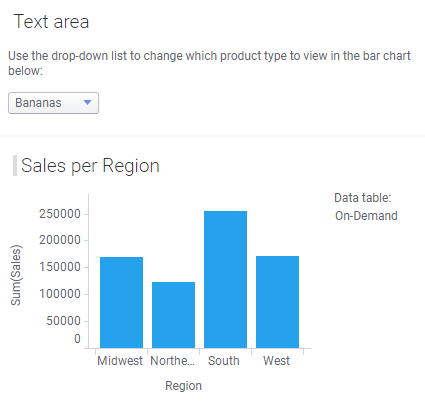
In the Edit Text Area dialog,
type some descriptive text to help other users understand what the
control will do.
Click on the Insert Property
Control button,  , and select which type of control
to add. In this example we will add a drop-down list.
, and select which type of control
to add. In this example we will add a drop-down list.
Response: The Property
Control dialog is displayed.
Select the previously specified
document property.
Select Set
property value through: Unique values in column.
Select the Data
table to be the first data table in the analysis (not the on-demand
data table).
Select the "Type"
Column.
If desired, you can limit
the values to be displayed in the drop-down list using a search expression.
Comment: Only those values matching the search
expression will be shown in the control. See Searching
in Spotfire for more information about valid search expressions.
Click OK
and, in the Edit Text Area dialog, click Save
before closing edit mode.
Response: The property control is added to the
text area.